Group processes and threads by attribute
You can group the processes and threads in the Processes & Threads view by attributes such as share group, process state, function, and thread ID. The Configure panel lists the attributes that you can group by. For a description of each attribute, see Attribute descriptions. For a grouping recommended for multiprocessing Python programs, see Group Python processes and threads.
On this page:
Group by attribute
-
If the Configure panel is not visible in the Processes & Threads view, drag the Configure bar to open it.

-
Select the check box for each attribute to group by.
Selected attributes appear in the view in the order in which they appear in the list.
-
(Optional) To change the order, select an attribute in the list and then select the move up (
 ) or move down (
 ) button. To restore the initial order and selection, select the reset button (
 ).Changing the order matters only for attributes that are selected. If a selected attribute passes another selected attribute, the grouping in the view changes.
-
(Optional) To hide the Configure panel, double-click the Configure bar.
The view groups the processes and threads by the selected attributes, in the order shown in the Configure panel. To change which columns are displayed, switch between tree and table view, or sort the view, see Change the layout of the Processes & Threads view.
Group Python processes and threads
When you debug a multiprocessing Python program, group by the following attributes, in this order, to see each script, the processes that run it, the named threads in each process, and the function where each thread is stopped:
-
Share Group
-
Process ID
-
Thread Name
-
Function
To keep this grouping separate from your other groupings, configure it in view 3.
-
In the Processes & Threads view, select the third view icon.

-
If the Configure panel is not visible, drag the Configure bar to open it.
-
Select the Share Group, Process ID, Thread Name, and Function check boxes, and clear any other check boxes.
-
Use the move up (
) and move down () buttons to arrange the selected attributes in the order listed above.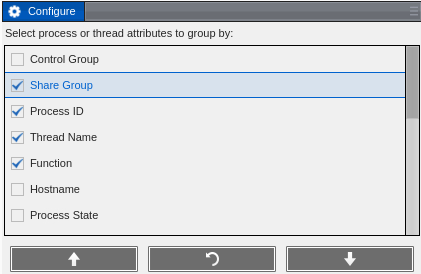
View 3 groups the Python processes and threads by script, process, thread name, and function. Select view 1 or view 2 to return to your other groupings. For more information about views, see Change the layout of the Processes & Threads view.
Attribute descriptions
The following table describes the attributes that you can select in the Configure panel and whether each applies to processes or threads.
|
Property |
Applies to |
Description |
|
Control Group |
Processes |
Control group of the processes in your program. Processes in the same program are placed in the same control group by default. If there is only one control group in the debug session, this property is omitted from the display. |
|
Share Group |
Processes |
Share group of the processes within a control group. Processes that are running the same main executable are placed in the same share group by default. |
|
Hostname |
Processes |
The hostname or IP address of where the process is running. |
|
Process State |
Processes |
The process execution state, for example, Nonexistent, Running, Stopped, Breakpoint, or Watchpoint. The process execution state derives from the execution state of the threads it contains. |
|
Thread State |
Threads |
The thread execution state, for example, Running, Stopped, Breakpoint, or Watchpoint. |
|
Function |
Threads |
The function name of the location of the stopped thread. Displays the function name or “<unknown address>” if the thread is running or the function name is not known. |
|
Source Line |
Threads |
The source code line of the location of the stopped thread. Displays the source file name and line number, or “<unknown line>” if the thread is running or the source line is not known. |
|
PC |
Threads |
The program counter of the location of the stopped thread. Displays the program counter value, or “<unknown address>” if the thread is running. |
|
Action Point ID |
Threads |
The action point ID (breakpoint or watchpoint) of the location of the stopped thread. Displays “ap(id)”, where id is the action point ID, or “none” if the thread is not stopped at an action point. |
|
Stop Reason |
Threads |
More detailed information on why the process/thread has stopped, such as stopping at an action point, receiving a signal, or encountering exit‑related events when stop‑on‑exit is enabled. To customize how TotalView handles signals, see Signal Action Settings. For more information about exit‑related events, see Stop execution on process or thread exit (Linux). |
|
Process ID |
Processes |
The debugger process ID (dpid) of the process. Displays dpid. |
|
Thread ID |
Threads |
The dpid and debugger thread ID (dtid) of the thread. Displays dpid.dtid. |
|
Thread Index |
Threads |
The thread index part of the Thread ID. For example, if the Thread ID is 3.2, the Thread Index is 0.2. |
|
Process Held |
Processes |
The ‘hold’ state of the process. This may be because of an explicit hold request, or because the process is waiting at a barrierpoint. |
|
Thread Held |
Threads |
The ‘hold’ state of the thread. This may be because of an explicit hold request, or because the thread is waiting at a barrierpoint. |
|
Replay Mode |
Processes |
The Replay state (Replay or Record) of a process that has Replay enabled. |
|
System TID |
Threads |
The systID, which is the user thread ID (user TID) if it exists. Otherwise, the system kernel ID (Kernel TID). |
|
User_TID/Kernel_TID |
Threads |
User thread ID / Kernel thread ID |
|
Thread Name |
Threads |
The name of the thread, if set. If unset, “unnamed” is displayed. |