Load the Program to Debug
On this page:
Loading program
Before starting TotalView, you must add TotalView to your PATH variable. For information on installing TotalView, see Installation and Licensing.
-
Start TotalView.
totalview
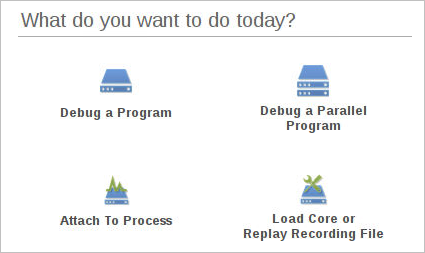
The Start Page launches.
-
Select Debug a Program to open the Program Session window.
-
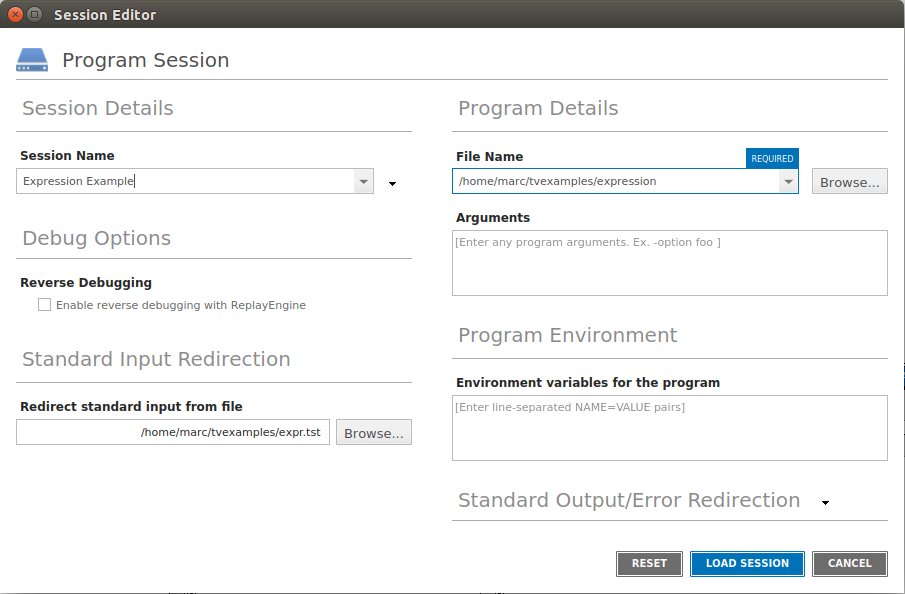
Provide a name for the session in Session Name field. This can be any string.
-
In the File Name field, browse to and select the expression program, located in the directory
install-dir/toolworks/totalview.version/platform/examples. -
In the Standard Input Redirection field, browse to and select the expr.tst file, also located in the examples directory. This provides the input required by the program. Leave all other fields and options as is.
-
Select Load Session to load the program into TotalView.
Note that this is the same as entering the path to the standard input file and program name as arguments when starting TotalView:
totalview -stdin expr.tst expression
This invocation assumes that your examples directory is known to TotalView or that you are invoking TotalView from within the examples directory.
|
Loading programs |
|
|
Starting a session from your shell |
|
|
Modifying arguments in an existing session |
Initial display
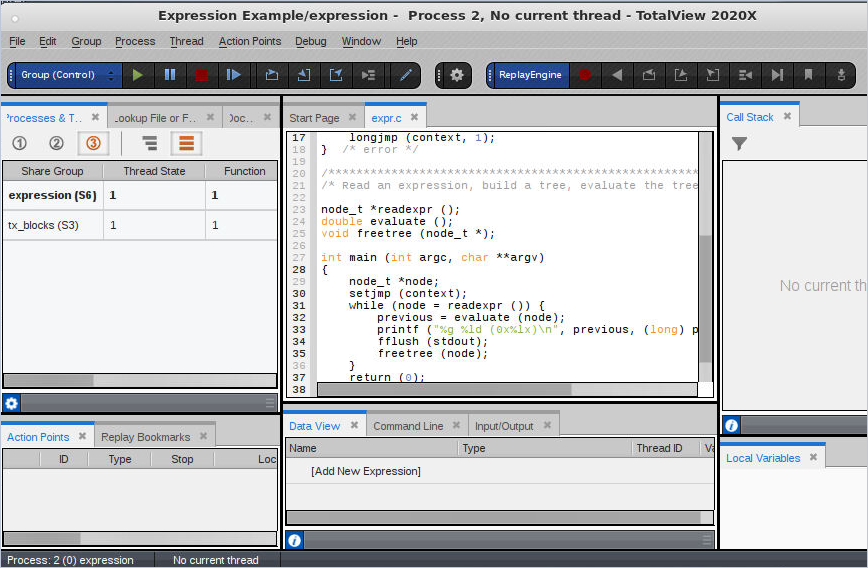
At startup, TotalView displays your program’s code in the central area’s Source view. Additional views may be visible, as described below.
Figure 18. TotalView’s views
-
The Processes & Threads view lists all processes and threads under TotalView control. You can use the Window > Views menu item to customize the displayed views.
-
Since the program has been created but not yet executed, there is no process or thread listed here.
-
The Lookup File or Function view takes any keyword search and returns a file or function from within your program’s files.
-
The Documents view displays all open files in the order in which their tabs appear in the central area.
-
The Replay Bookmarks view displays bookmarks created to mark a point in program execution history.
-
The Action Points view displays any breakpoints you set.
-
The Call Stack view shows the backtrace of the thread that is currently in focus once the program is running.
-
The Local Variables view displays information on the current thread’s variables.
-
The Source view in the central area displays your source code’s main() function before execution.
-
The Data View enables you to evaluate expressions to observe your data while your program is running.
-
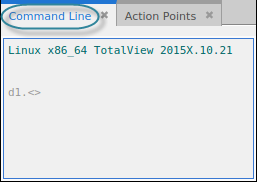
The Command Line view displays a prompt for entering CLI commands.
-
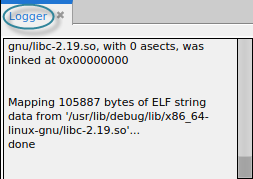
The Logger view displays logging output from TotalView.
-
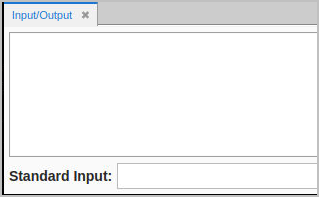
The Input/Output view displays stdout and stderr, and supports entering input directly into the user interface rather than only through the terminal. This view is turned off by default. To display it, select Window > Views > Input/Output.
To learn how to show or hide a view and for an additional overview of the views, see Views in TotalView.
|
Processes & Threads view |
|
|
Call Stack view |
|
|
Action Points |
|
|
The CLI |