Configuring the GPU Status View
You can group and sort the aggregated data based on a range of state variables, using the Configuration Options dialog, opened by selecting the configure icon ( ).
).
Figure 143, GPU Status Configuration Options dialog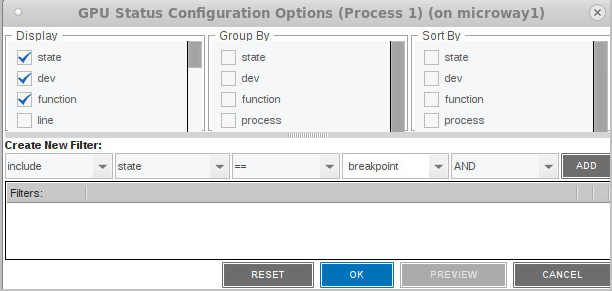
Select Variables to Display
Variables selected in the Display column are placed into the Group By and Sort By columns where they are available to be selected to change the aggregation. Some variables are selected for display by default, including state, dev, function, process, sm, warp, and lane. Add or remove variables by checking them in the Display column. Table 19 lists all available state variables.
Selecting or deselecting any item in this dialog activates the Preview button. For example, select line to add it to the display, then press Preview.
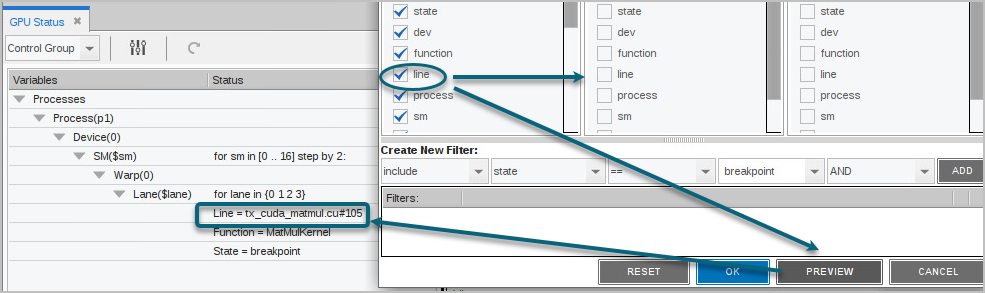
The line number is added to the display.
Preview provides just a temporary display of the view. Click OK to save the view or Reset to return the view to its default settings. Cancel closes the view with no changes.
Select Variables to Group or Sort By
Select one or more variables in the Group By or Sort By columns to change the grouping and sorting display.
Display by logical coordinates
For example, check the logical coordinates (bx, by, bz, lx, ly, lz) under Display, then select them in the Group By menu to change the display to logical coordinates, and then group by those coordinates.
Figure 144, Configuration “Group By”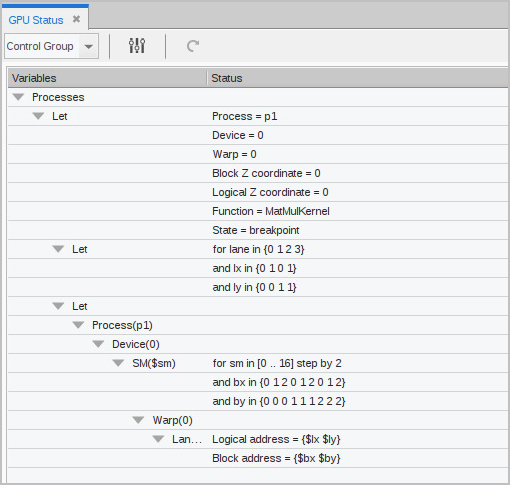
Group by state
Consider a program in which the threads unexpectedly diverge, as displayed in the view:
Figure 145, Diverging threads in the GPU Status View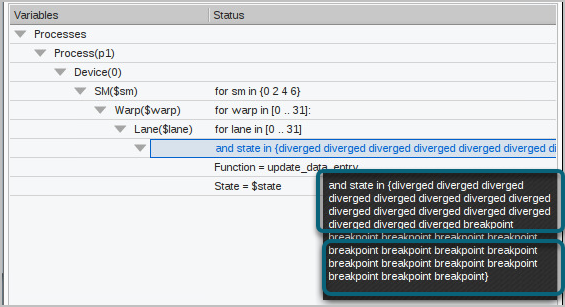
To make the view more useful, add line to the display and then group by lane state.
Figure 146, Grouping by thread state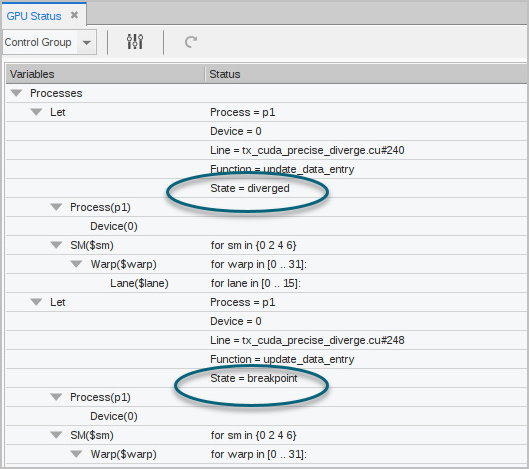
While the information has not changed, it’s now easy to see that, in every warp and SM, half the lanes — numbers 16 through 31 — have hit the breakpoint on line 248. The other half of the lanes — numbers 0 through 15 — have diverged and are all at line 240.
You can use an include custom filter to refine the view further. See Configuring Custom Filters.
State Variables for Grouping and Sorting
State Variable | Description |
|---|---|
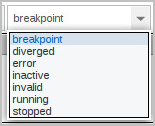
state | State of a lane. An enumerated value |
dev | Device ID for GPU (an integer) |
function | Name of the function that contains a lane PC |
line | "filename#number": the file and line number of a lane PC |
process | CPU process ID, either as MPI rank or as dpid |
sm | ID of an SM (an integer) |
warp | ID of a warp within an SM (an integer) |
pc | PC of a lane (an integer) |
lane | ID of a lane within a warp (an integer) |
dev_type | GPU device type (a character string) |
sm_type | SM type for the GPU (a character string) |
sm_count | Number of SMs in the device (an integer) |
warps_per_sm | Number of warps in each SM (an integer) |
lanes_per_warp | Number of lanes in each warp (an integer) |
regs_per_lane | Number of registers available to each lane (an integer) |
valid_warp_mask | Bit mask indicating which warps are valid in an SM |
valid_lane_mask | Bit mask indicating which lanes are valid in a warp |
active_lane_mask | Bit mask indicating which lanes are active in a warp |
broke_lane_mask | Bit mask indicating which lanes are at breakpoints |
bx | X coordinate of a block (an integer) |
by | Y coordinate of a block (an integer) |
bz | Z coordinate of a block (an integer) |
lx | X coordinate of a thread within a block (an integer) |
ly | Y coordinate of a thread within a block (an integer) |
lz | Z coordinate of a thread within a block (an integer) |
Configuring Custom Filters
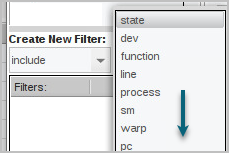
Create a custom filter in the Create New Filter pane in which you can include or exclude values that match or do not match the values of certain state variables from the display. This pane contains combo boxes for building the filter.
For example, if “include” comes first, then only threads meeting the criteria will be included. If '“exclude” is first, then all threads that don't meet the criteria will be displayed. Subsequent “include” and “exclude” filters define exceptions to this overall behavior. See Figure 148 for an example.
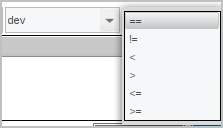
To build a filter, select the elements, then click ADD.
Examples
Let’s look again at the program in which the threads diverged (Figure 145). In addition to grouping the output by thread state, Figure 147 uses a custom filter to limit the display to show only those threads that have diverged.
Figure 147, Custom filter by a state of “diverged”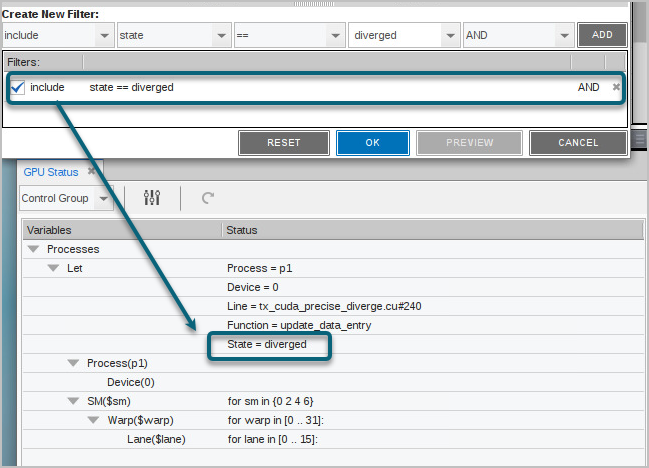
You can create multiple custom filters, and activate or de-activate them using the left checkbox.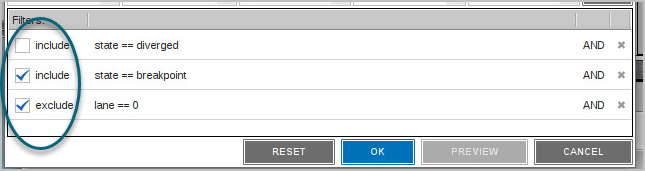
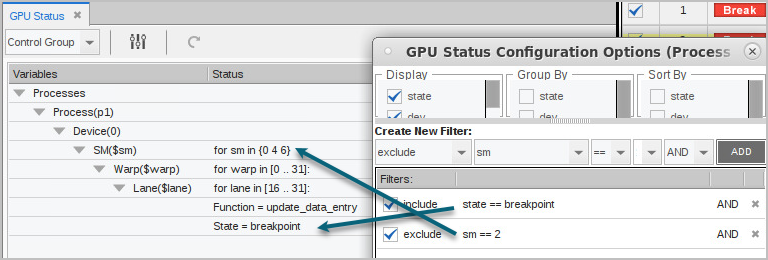
Use “include” and “exclude” together to establish the overall filter behavior, then refine it. Figure 148 first includes all threads at breakpoint, but then excludes those running on SM 2.
Figure 148, Mixing include and exclude filters