The GPU Status View
Along with using GPUs and other hardware accelerator processing units designed for HPC computing, programmers may also incorporate hybrid parallelism combining multiple MPI processes with other multi-threaded and device-aware programming models intended to effectively harness on-node parallelism, such as OpenMP.
Given the scales and number of layers involved, global GPU analysis features are required to be able to determine the execution state of one or more GPUs in a job. For example, a process running code on a single GPU may contain tens of thousands of executing lanes (i.e., threads). The individual lanes are grouped into warps of 32 lanes while hundreds of warps are grouped into blocks. Thousands of blocks are then spread across dozens of streaming multiprocessors.
Compounding the complexity found on a single GPU, a single process may be running code on multiple GPUs, and that process may be part of an MPI job consisting of tens, hundreds, or even thousands of processes, each running code on their own GPUs. Even a modest-sized MPI job may consist of millions of blocks and tens of millions of lanes.
The GPU Status View provides the ability to filter, sort, and aggregate GPU execution status and to control the focus to support setting group, process, and device (CUDA context thread) widths.
Using this view, you can:
By default, the selected state variables used in the aggregation include the process ID, the device, the CUDA thread execution state (i.e., stopped, breakpoint, etc.), the function, and the GPU physical device information (SM, warp, lane).
The GPU Status View is a visual representation in the UI of the CLI command dgpu_status.
To turn on the view, load a GPU program, then select Windows > Views > GPU Status. The view is empty until the program starts running.
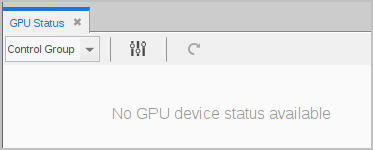
The view also opens automatically when TotalView recognizes a kernel loaded on the device and a CUDA context thread is created.


