Task 8: Obtaining Detailed Heap Information
This task discusses the Source and Backtrace reports, Figure 63.
Figure 63: Heap Status Source and Backtrace Reports 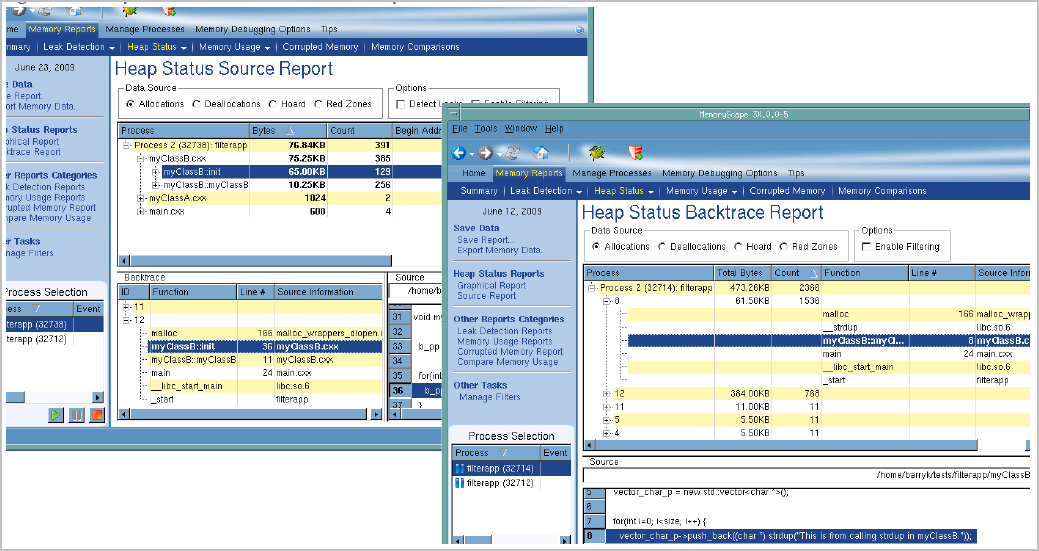 |
These reports are the most important sources of information within MemoryScape. While these reports relate directly to the Heap Status reports, they are available throughout MemoryScape as separate reports or as areas within a report.
The totals shown in the Heap Status reports may differ slightly from those n the Memory Usage reports, because heap status is generated from monitoring program requests for memory (malloc or new) and program release of memory (free or delete), while memory usage data is obtained from the operating system facilities. Depending on the operating system, memory usage totals may include anonymous memory regions that the program or one of its libraries may have mapped into its address space. The totals also include a small amount of overhead from MemoryScape itself.
The Memory Usage report is intended to be a quick check of your program’s memory usage from the system’s perspective. For detailed information on your program’s use of the heap, use the Heap Status reports.
Which report to use, or when to use it, depends on how you want to approach the data. In general, most users prefer to approach this kind of information through Source reports. However, some like to see memory information organized on the way the program creates blocks.
Before reading this task, you should be familiar with the following information:
An overview of memory concepts and MemoryScape.
How to start MemoryScape and a summary of the kinds of information you can obtain.
How to start and stop program execution.
How to obtain a graphic overview of the way this heap is laid out, as well as how to get more detailed information about individual blocks.
Topics in this task are:


