Task 4: Controlling Program Execution
This task discusses how to control a program’s execution from within MemoryScape. Once you’ve added programs to MemoryScape, you are ready to execute your program(s). During execution, MemoryScape collects memory information. For long-running programs, you will want to start execution, stop it, look at memory information, and then continue execution.
MemoryScape allows you to halt your program’s execution at any time. However, it does not allow you to select the exact code location for your program to stop, and the program may stop inside a malloc or new call. If this happens, you may see an odd corrupt guard block or leak in your reports. When your process resumes execution, it will clear up the odd result.
If you require fine program control using breakpoints, or you need thread control, use TotalView with MemoryScape. See Debugging with TotalView.
Before reading this task, you should be familiar with the following:
An overview of memory concepts and MemoryScape.
How to start MemoryScape and an overview of the kinds of information you can obtain.
How to configure MemoryScape so that it performs the activities you want it to perform.
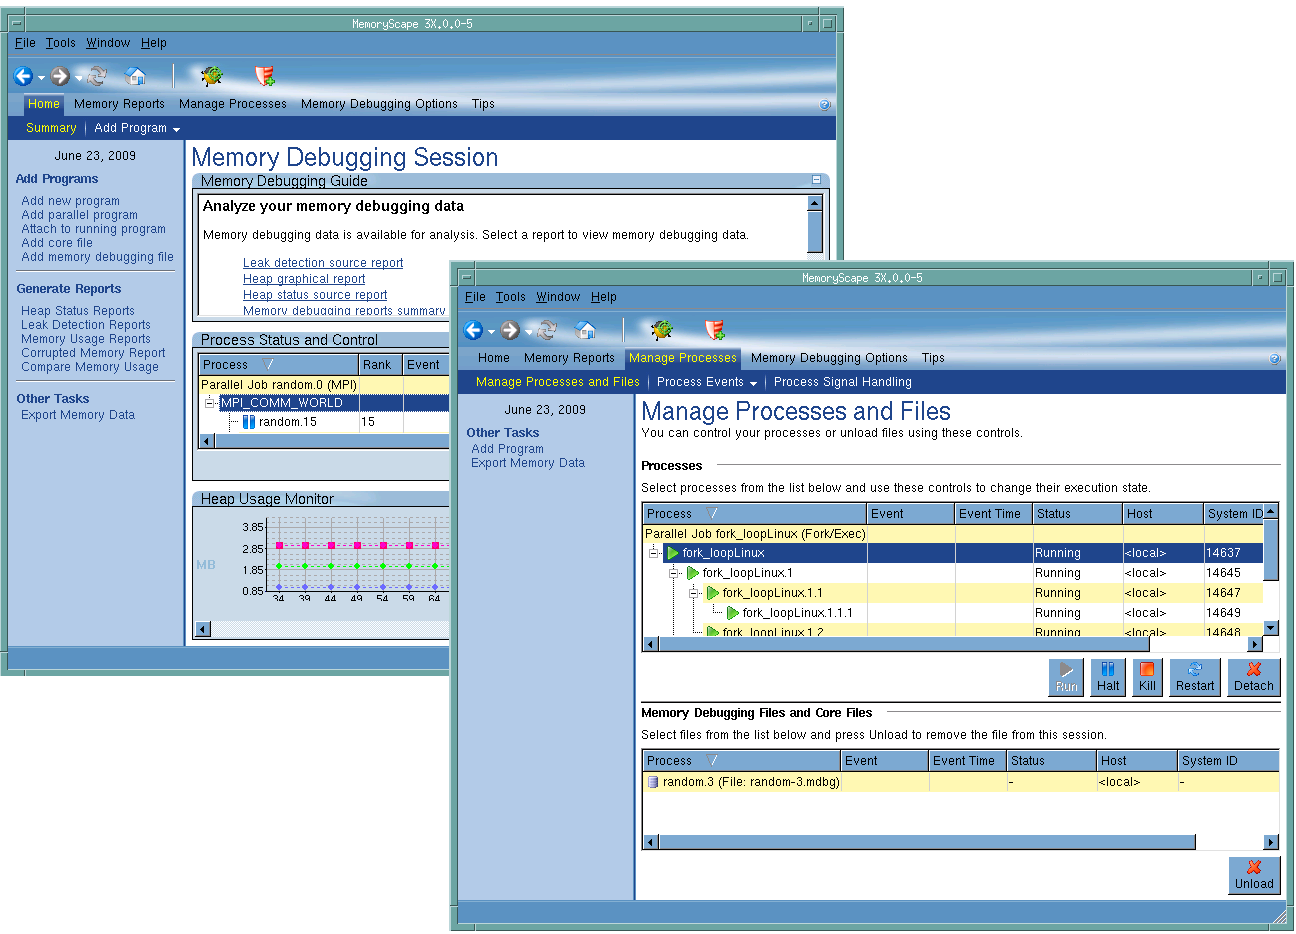
The controls for starting and stopping program execution are on the Home | Summary screen as well as the lower left corner of many screens. Additional controls are in the Manage Process and Files screen, Figure 52.
Figure 52: Execution Controls |
 |
Topics in this task are:


