Parallel Backtrace View
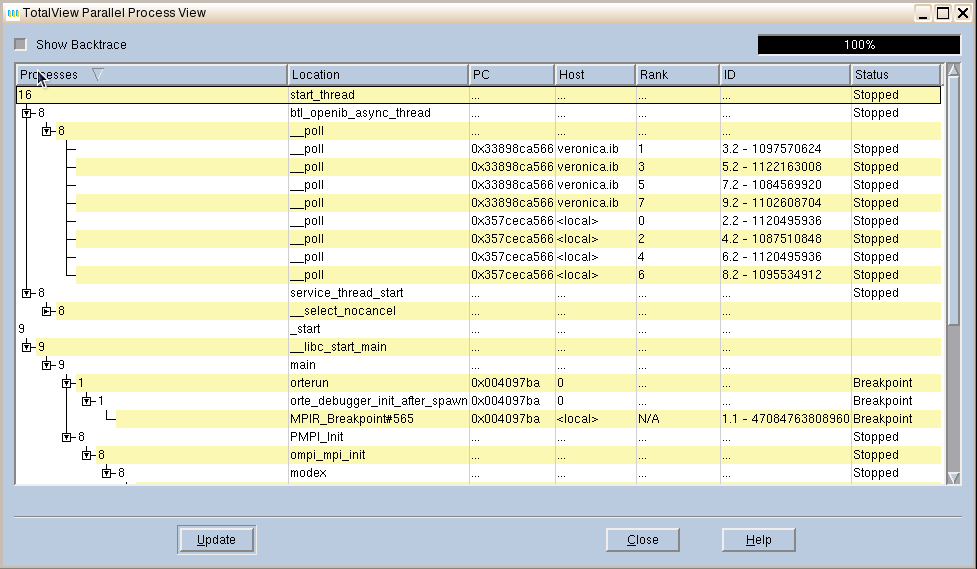
The Parallel Backtrace View displays in a single window the state of every process and thread in a parallel job, including the host, status, process ID, rank, and location. In this way, you can view thousands of processes at once, helping identify stray processes.
Access the Parallel Backtrace View from the Tools menu.
The Parallel Backtrace View shows the position of a program’s processes and threads at the same time, displayed as a branching tree with the number and location of each process or thread at each point, as follows:
 Processes:
 the number of processes/threads at a particular location, shown as a branching tree. Expanding the branch shows the next level of the call hierarchy, eventually down to the line of source code. At each level the number of processes in the first column may change.
 Location:
 the location of the process/thread with line number if applicable.
 PC:
PC: the program counter of the process/thread.
 Host:
Host: the node on which the process/thread is executing.
 Rank:
Rank: the thread rank of a parallel program. N/A indicates no rank.
 ID:
ID: process ID and thread ID (if applicable).
 Status:
 process status.
Diving (with the right mouse button) on each expanded item displays its process window
The progress indicator in the upper right reports the progress of collecting and displaying information.
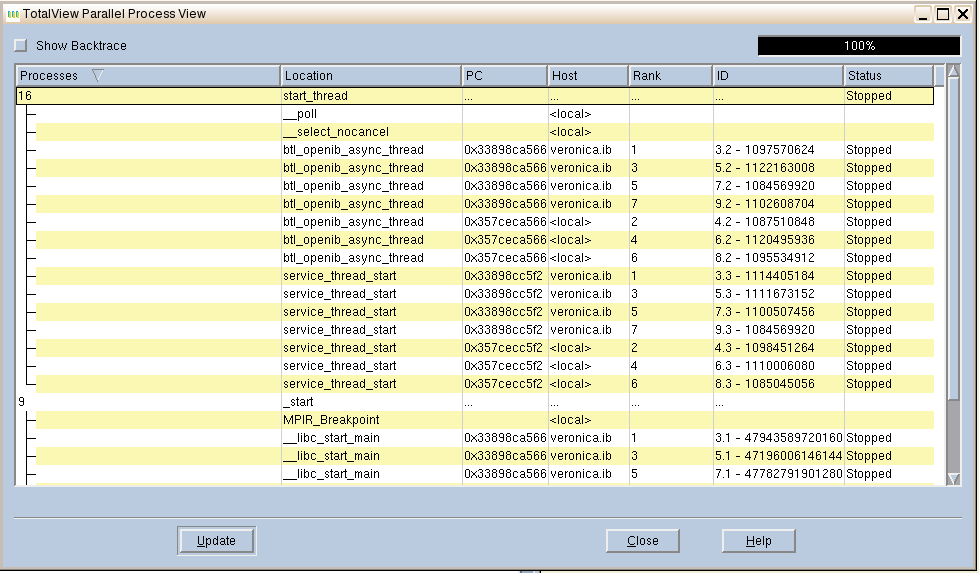
Using the Show Backtrace toggle in the upper left hides the intervening branches and displays the start routine and current execution location of the processes or threads. This removes some of the clutter in the display, as shown above.
If a thread/process state changes, the data becomes stale, and an alert is displayed at the bottom of the window,
Figure 148.
Use the Update button to refresh the display.


