Memory Leak Detection
TotalView can locate your program’s memory leaks and display related information. For an overview of memory leaks in general, see Memory Leaks.
Leaks are reported in the Leak Report view. To generate a leak report, either:
Run the program and then halt it when you want to look at memory problems. (Allow your program to run for a while before stopping execution to give it enough time to create leaks.)
If your program runs to the end without stopping for a breakpoint or other reason, and memory debugging is enabled, a prompt displays before the program exits, asking if you want to create a link report.
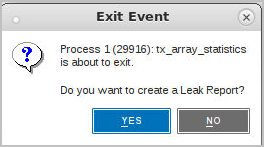
Clicking Yes generates the report.
or
Select Debug > Generate Leak Report.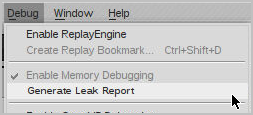
At launch, the Leak Report displays in the UI’s central area, Figure 152.
Figure 152, Leak Report, initial view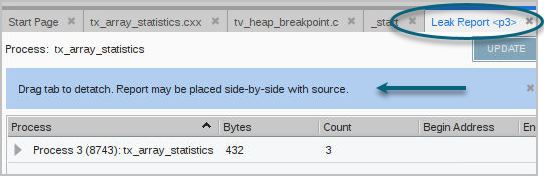
For the best viewing, detach the report and dock it beside any open source window to view the code and the report side-by-side, as suggested when it initially displays. This enables you to examine source level details as you explore the report’s leak data.


