Memory Heap Reports
TotalView can locate heap allocations and display related information. Heap allocations are derived from monitoring program requests for memory (malloc or new).
Heap allocations are reported in the Heap Report view. To generate a heap report, enable memory debugging (Debug > Enable Memory Debugging), then run your program either to the end or to a breakpoint.
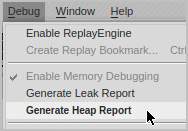
Select Debug > Generate Heap Report.

(Note that, when memory debugging is enabled and your program runs to the end without stopping for a breakpoint or other reason, a prompt displays before the program exits, asking if you want to create a Leak Report. A Heap Report is not dependent on a Leak Report so you may click No.)
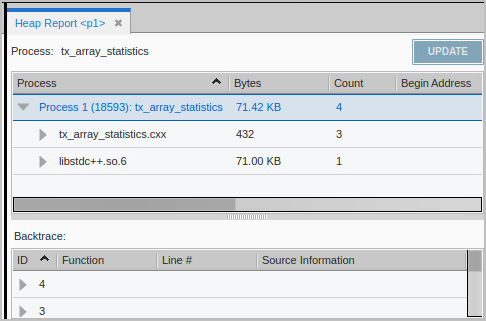
The Heap Report displays docked in its own pane by default, Figure 158, or as a tab next to the Leak Report if there is one open.
Figure 158, Heap Report, initial view


