Working with and Viewing Processes and Threads
You can view the status of any or all your processes and threads in a variety of ways.
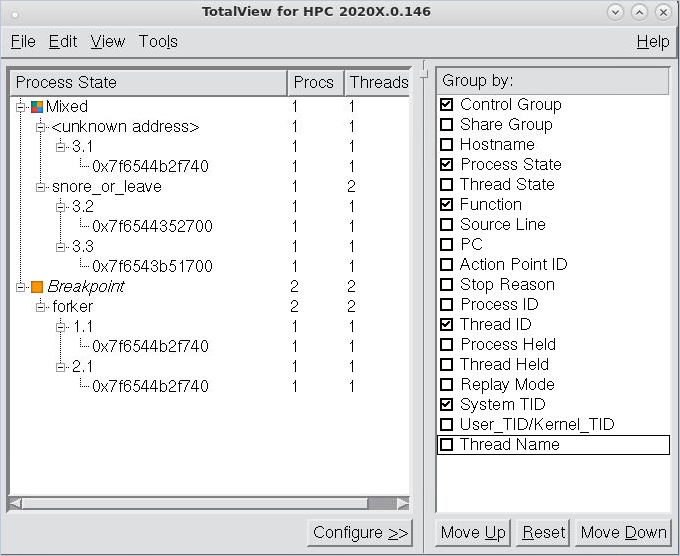
The Root Window contains an overview of all processes and threads being debugged. Just dive on a process or a thread for detailed information.
 |
The Process Window’s Processes tab (when the process grid is enabled) and Threads tab display information about all threads and processes, color-coded to define state.
Figure 20 shows a tab with processes in three different states:
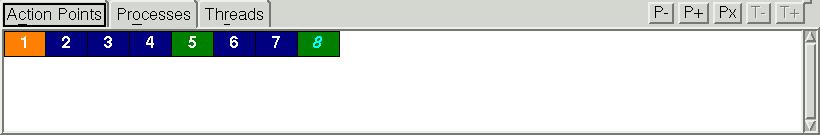 |
The orange cells represent processes that are at a breakpoint, blue is a stopped process (usually due to another process or thread hitting a breakpoint), and green denotes that all threads in the process are running or can run.
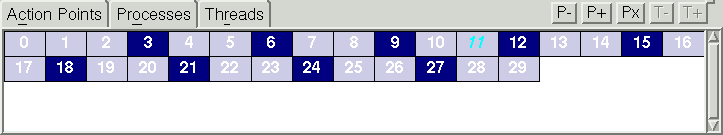
If you select a group using the Process Window’s group selector pulldown menu, TotalView dims the blocks for processes not in the group, Figure 21.
 |
To switch between running processes, click on a box representing a process to switch to that context.
Similarly, clicking on a thread in the Threads tab changes the context to that thread.
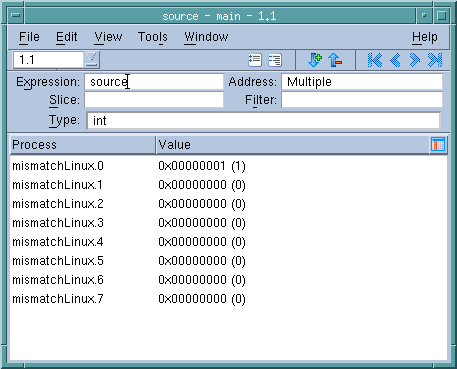
Viewing the value of a variable in each process or thread:
It is often useful to simultaneously see the value of a variable in each process or thread. Use View > Show Across > Thread or View > Show Across > Process to display the variable either across processes or threads, Figure 22.
 |
If you are debugging an MPI program, use the Tools > Message Queue Graph Window graphically to display the program’s message queues.
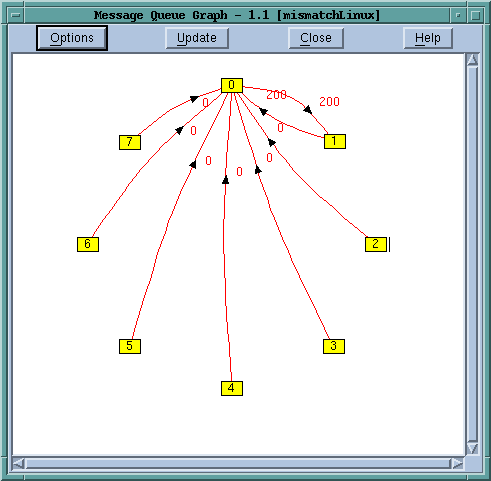 |
You can click on the boxed numbers to place the associated process into a Process Window, or click on a red number next to an arrow to display more information about that message queue.
Manipulating processes and threads in various ways | |


