Analyzing Memory
To analyze how your program is using memory, select the Heap Graphical Report on the Memory Reports Page to see the memory your program is using, Figure 28.
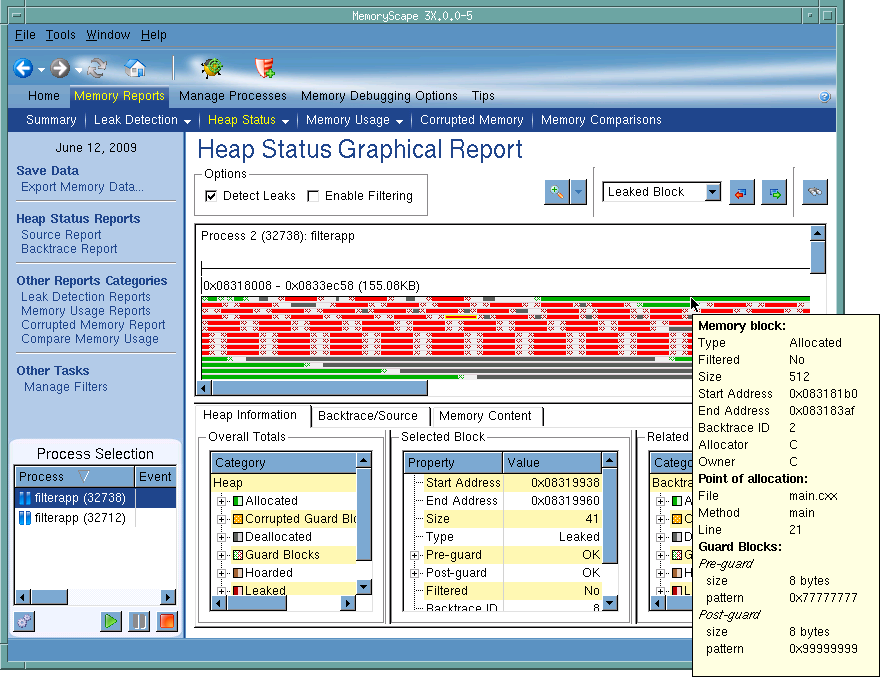 |
When you select a block in the top area, MemoryScape displays information about the selected block in the lower area. In addition, and perhaps more importantly, it displays how many other allocations are associated with the same backtrace and the amount of memory allocated from the same place. Other reports within the Heap Status Reports Page let you display the backtrace and source line associated with an allocation.
The heap graphical report | |


