Viewing Call Stack Data
Let’s consider the Source View alongside the Call Stack. The Source View displays your program’s source code and any breakpoints you have set. The highlighted yellow line and arrow shows where execution has stopped.
In this example, the program is within the block that starts at line 680, with the Program Counter, or PC, stopped at line 681. At that scope is a local struct variable, timeout, displayed in the Local Variables view.
Figure 51, The Local Variables view displays local variables for the TOI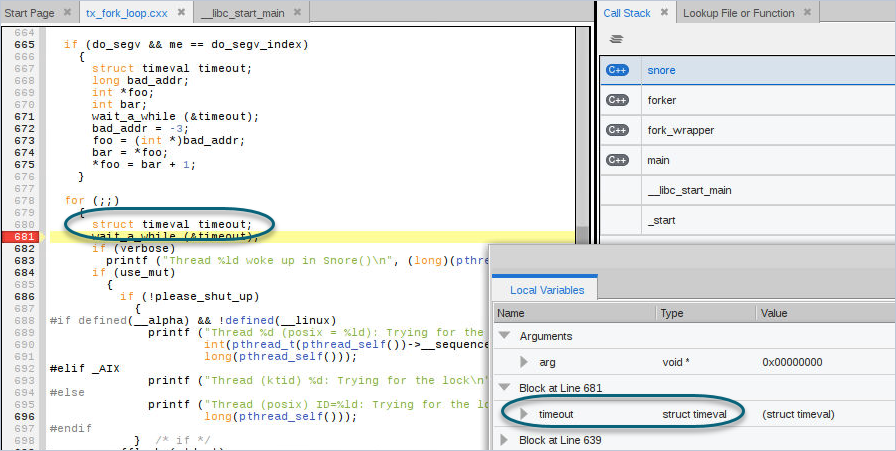
The Call Stack view uses icons to identify several functions as C++. Other possible icons include Fortran or C. If a language is displayed, then there is debug information for that frame, so, for instance, __libc_start_main and _start have no debug information, and the source is not available. If selected, “Source not available” displays.
Figure 52, Source not available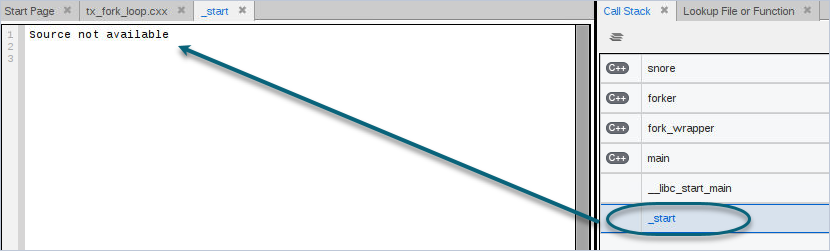
Refocusing the Source View updates the Local Variables View
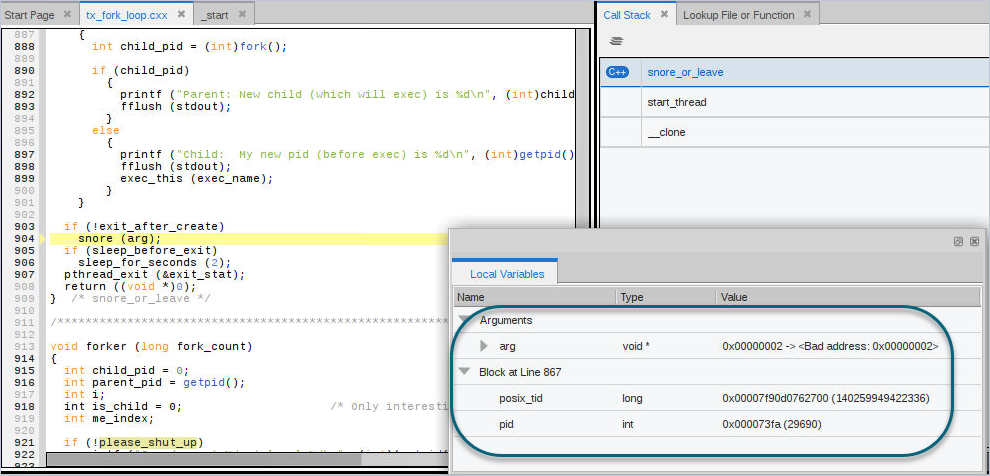
Move up and down in the stack trace in the Call Stack View and select a new frame to refocus the Source View to the selected source for that routine. Figure 53 illustrates that moving down the stack to snore_or_leave updates the Local Variables view with new local values and arguments.
Figure 53, Refocusing the Frame