The GPU Status View Focus Options
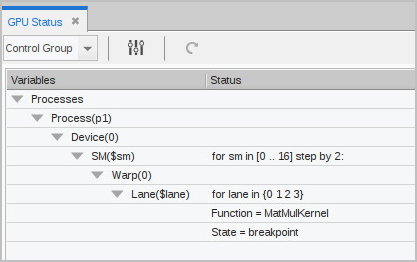
Figure 132 shows the view after a program has loaded a GPU kernel and stopped at a breakpoint. By default, the view displays the process ID, physical GPU coordinates, function name, and execution state.
Figure 132, GPU Status View

This GPU program is running:
The view has a Focus width dropdown which includes the Control Group, Share Group, Process, and a list of any CUDA context threads within the focus process.

The focus width is based on the process that is currently in focus in the UI. A focus of "Share Group," for example, it would be the share group containing the process in focus in the UI.
Other features of this view:
 ) updates the view. The view is not automatically updated when status changes. When grayed out, the view is up to date.


