Viewing GPU Threads
Once the CUDA kernel starts executing, it will hit the breakpoint planted in the GPU code, as shown in Figure 125.
Figure 125, CUDA thread stopped at a breakpoint, focused on GPU thread <<<(0,0,0),(0,0,0)>>>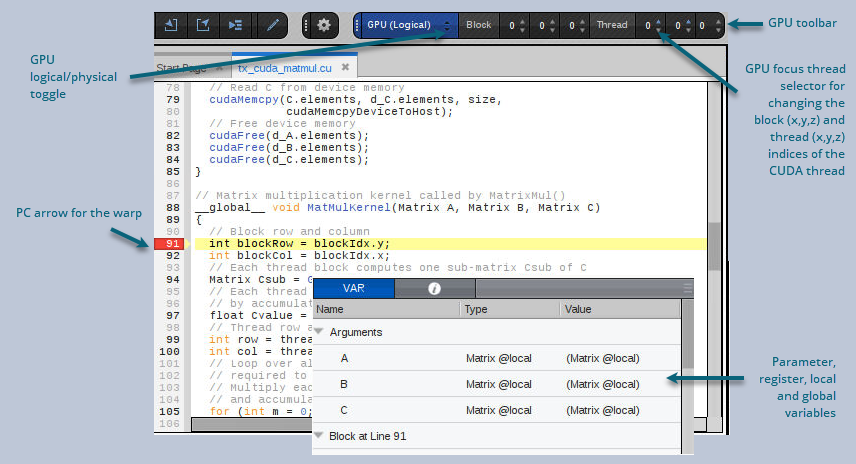
The logical coordinates of the GPU focus threads are displayed in the GPU toolbar. You can use the GPU focus thread selector to change the GPU focus thread. When you change the GPU focus thread, the logical coordinates displayed also change, and the Call Stack and Source view are updated to reflect the state of the new GPU focus thread.
The yellow PC highlighted line in the Source view shows the execution location of the GPU focus thread. The GPU hardware threads, also known as "lanes," execute in parallel so multiple lanes may have the same PC value. The lanes may be part of the same warp (up to 32 maximum threads that are scheduled concurrently), or in different warps.
The Local Variables view shows the parameter, register and local variables for the function in the selected stack frame. The variables for the selected GPU kernel code or inlined function expansion are shown.
The Call Stack shows the stack backtrace and inlined functions: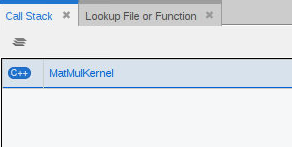
Each stack frame in the stack backtrace represents either the PC location of GPU kernel code, or the expansion of an inlined function. Inlined functions can be nested. The "return PC" of an inlined function is the address of the first instruction following the inline expansion, which is normally within the function containing the inlined-function expansion.


