Displaying Call Trees and Call Graphs
Debugging is an art, not a science. Debugging often requires the intuition to guess what a program is doing and where to look for problems. Just locating a problem can be 90% or more of the effort. A call tree or call graph can help you understand what your program is doing so that you can understand how your program is executing.
To display a call tree or call graph, select Tools > Call Graph from the Process Window. A sample call tree is shown in Figure 169.
The call tree or call graph shows all currently active routines linked by arrows indicating if one routine is called by another. The display is dynamic in that it shows activity at the moment it is created. The Update button recreates the display.
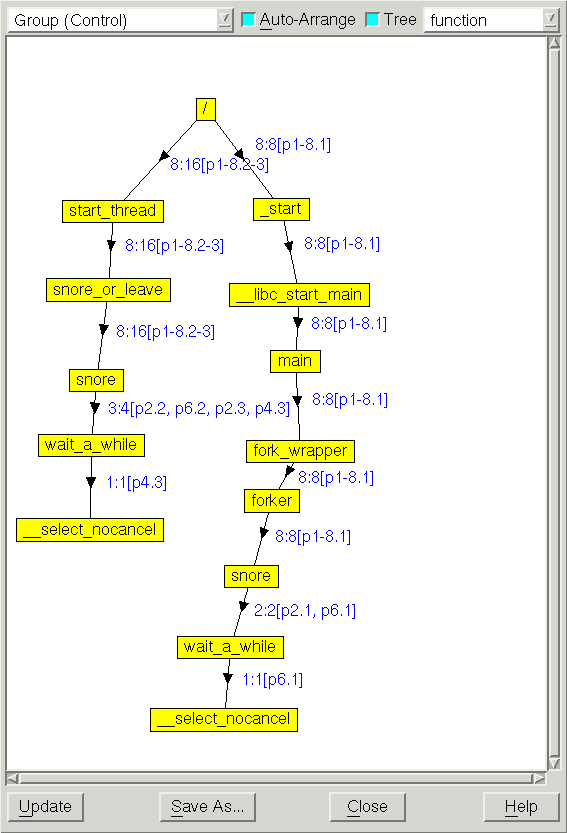 |
You can toggle between displaying a call tree or call graph for specific processes and threads using the controls at the top of this window. By default, TotalView displays a tree representing the backtrace of all the selected processes and threads. To change to a Graph Style display, deselect the Tree button.
For multi-process or multi-threaded programs, a compressed process/thread list (ptlist) next to the arrows indicates which threads have a routine on their call stack.
Similar to the CLI's dwhere -group_by option, the dropdown in the call tree window enables you to aggregate the backtraces according to different properties, as follows:
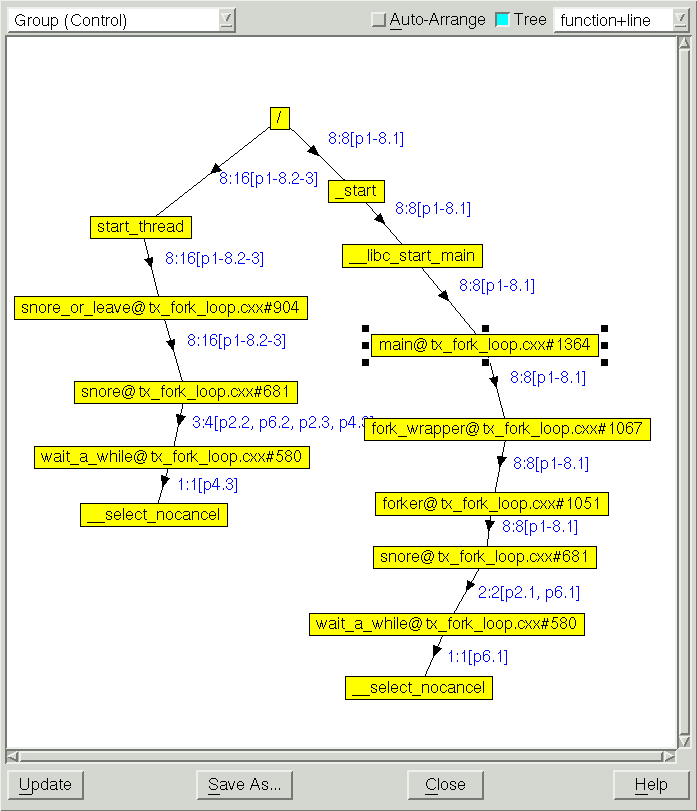
For example, Figure 170 displays the call tree grouped by function and line:
 |
Diving on a routine within the call tree or call graph creates a group called call_graph, containing all the threads that have the routine you dived on in its call stack. If you look at the Process Window’s Processes tab, you’ll see that the call_graph set is selected in the scope pulldown.
 |
In addition, the context of the Process Window changes to the first thread in the set.
As you begin to understand your program, you will see that this diagram reflects your program’s rhythm and dynamic. As you examine and understand this structure, you will sometimes see things that don’t look right — these are often places where you should look for problems.
Diving on a routine that doesn’t look right can isolate the processes into their own group so that you can find out what is occurring there. Be aware that diving on a routine overwrites the group, so if you want to preserve the group, use the Groups > Custom Groups command to make a copy.
A call tree or call graph can also reveal bottlenecks. For example, if one routine is used by many other routines and controls a shared resource, this thread might be negatively affecting performance.


