Tools > Call Graph
Displays a window that shows a graphical representation of your program’s stack. This representation, which is called a call graph or a call tree, is a dynamic representation of your program’s state.
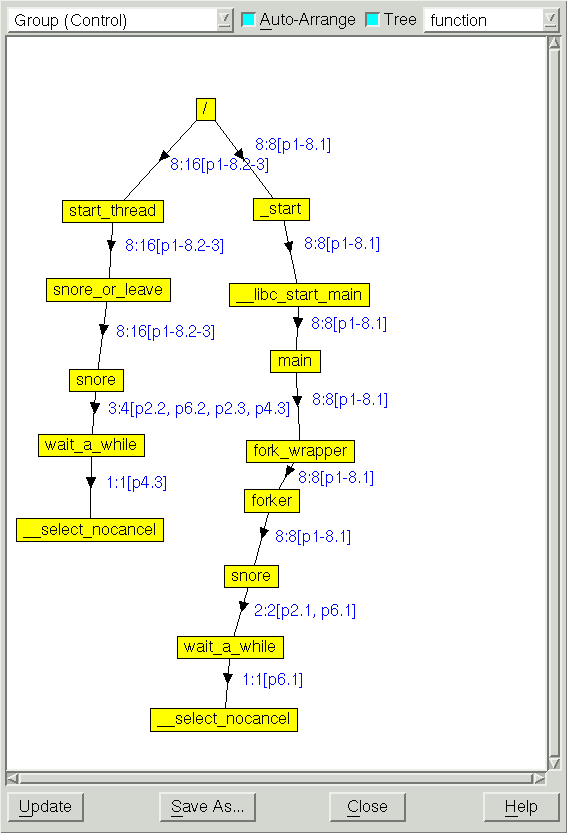 |
Functions and subroutines are displayed as boxes. The lines linking functions and subroutines to one another indicate that one routine was called by the other, with the arrow pointing to the called routine.
The numbers next to a link indicates the threads or ranks that called the routine. If there are a great number of ranks or threads, diving on the arrow displays an information box listing them in a more legible format.
For multi-process or multi-threaded programs, a compressed process/thread list (ptlist) next to the arrows indicates which threads have a routine on their call stack.
Similar to the CLI's dwhere -group_by option, the dropdown in the call graph window enables you to aggregate the backtraces according to different properties, as follows:
If you dive on the numbered list, TotalView displays a list containing all of the threads running into a routine.
Here’s what the Update and Save As buttons do:
Update
Updates the display. This is useful if you are displaying a call graph while your program is executing or if you select a different item within the Group pulldown.
Save As
Writes the call graph to disk using the .dot format used by such tools as Graphviz. For more information, see http://www.graphviz.org/.


