Starting TotalView and Creating a Debugging Session
NOTE: TotalView has a new user interface with improved debugging workflows, features, and a modern look and feel. Existing TotalView users can opt to use the new UI by selecting the UI preference on the Display tab in the Preferences dialog.
For new TotalView users, the new UI is the default, but you can revert to the Classic TotalView UI, if necessary, by changing the Display preference on the Preferences tab. To learn more about using the new UI, see the new UI HTML documentation in the TotalView distribution at <installdir>/totalview.<version>/help/html/TotalView_Help, or the online TotalView documentation set and Getting Started Guide.
For new TotalView users, the new UI is the default, but you can revert to the Classic TotalView UI, if necessary, by changing the Display preference on the Preferences tab. To learn more about using the new UI, see the new UI HTML documentation in the TotalView distribution at <installdir>/totalview.<version>/help/html/TotalView_Help, or the online TotalView documentation set and Getting Started Guide.
NOTE: The most common way to start TotalView is by entering:
totalview program_name
where program_name is the executable of the program you are debugging.
NOTE: To run a program in TotalView, compile it for debugging, usually with the -g command-line option, depending on your compiler.
Starting TotalView with no arguments (i.e. just totalview) launches the Start a Debugging Session dialog.
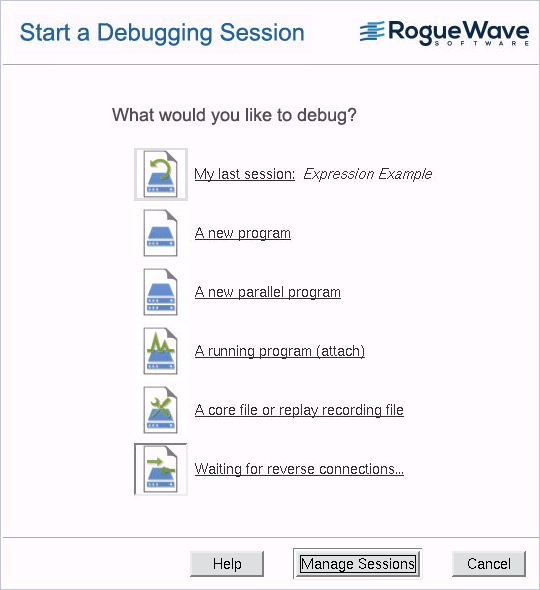 |
This dialog is part of the Sessions Manager and is the easiest way to load a program into TotalView. Once you configure a debugging session using this dialog, the settings are saved so you can access them later.
From here, you can:
1. Open a debugging session
Select a type of session:
A new program
to launch the Program Session dialog and selecting a program to debug (equivalent to starting TotalView with a program name argument).
A new parallel program
to launch the Parallel Program Session dialog and entering parallel system settings.
A running program (attach)
to launch the Attach a running program(s) dialog and selecting an already-running process.
A core file or replay recording file
to launch the Core or Replay Recording Session File dialog and selecting an executable and associated core file or replay recording session file.
My last session
to launch a debugging session using your last session.
2. Manage your debugging sessions
Select Manage Sessions to edit, delete, or view the details of any saved sessions.
Compiling your program for debugging |


