AMD ROCm GPU Toolbars
When focused on a GPU thread (agent or wave) two GPU toolbars are active in the user interface. These GPU toolbars enable navigating two coordinate spaces, as follows:
-
GPU (Logical): This toolbar represents the logical coordinate space that, in AMD GPU terms, incorporates work-groups and work-items. For example, (Bx,By,Bz)[Tx,Ty,Tz], where (Bx,By,Bz) represents the block indices and [Tx,Ty,Tz] represents the thread indices.
-
GPU (Physical): This toolbar represents the "physical coordinates," such as agent, queue, dispatch, wave, and lane.
Any given work-item has a position in both the physical coordinate space and the logical coordinate space. Changes in one coordinate space are reflected in the other.

To view a host CPU thread, select a thread with a positive thread ID in the Processes & Threads View. To view a GPU agent thread or wave thread, select an agent or wave thread with a negative thread ID, then use the GPU work-group and/or work-item selector on the logical toolbar to focus on a specific GPU work-item.
There is one GPU focus per GPU agent thread or wave thread, and changing the GPU focus affects all windows displaying information for that agent and all command line interface commands targeting that agent. In other words, changing the GPU focus work-group or work-item can change the GPU data that is displayed and affect other commands, such as single-stepping.
In all cases, when you select a work-item, TotalView automatically updates the Source view, Call Stack, Data View, and Action Points view to match the selected work-item.
Using the GPU Toolbars in Wave-Thread Mode
The GPU toolbars are the same regardless of agent-thread or wave-thread mode. The mode simply affects how the debugger handles GPU focus changes. In wave-thread mode, changing the GPU focus might focus the UI on a different debugger thread for the following reasons:
-
Agents, queues, dispatches, and waves cross wave boundaries.
-
Workgroups cross wave boundaries.
-
Work-items might cross wave boundaries if the number of lanes in the workgroup is greater than the wavefront size.
This has the following impact on GPU toolbars in wave-thread mode, where there is a 1:1 binding of debugger thread to GPU wave:
-
Using the physical GPU toolbar to change the GPU agent, queue, dispatch, or wave focus will change the UI’s debugger thread focus.
-
Using the logical GPU toolbar to change the GPU block or thread index might change the UI’s debugger thread focus if the new logical coordinates correspond to a different wave on the agent.
It is not possible to change the CLI focus by using the drocm command to change the GPU agent, queue, dispatch, or wave focus. Instead, the dfocus command must be used to focus on the debugger thread bound to the desired GPU wave; the agent, queue, and dispatch are bound to the wave, so changing the CLI focus implicitly changes the other physical coordinates.
Example
Figure 156 shows four wave threads for a 2x2 grid of 2x2 workgroups. The first column is the debugger thread identifiers for the waves. The second column is the colon-separated agent, queue, dispatch, and wave identifiers for the waves. The third column is the workgroup coordinates and flattened work-item offset of the waves.
Figure 156. Four wave threads for a 2x2 grid of 2x2 workgroups
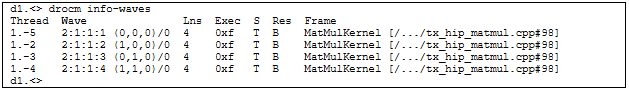
Figure 157 shows the user interface focused on wave thread 1.-5, which corresponds to physical wave 2:1:1:1 with workgroup index (0,0,0) and flattened lane index 0.
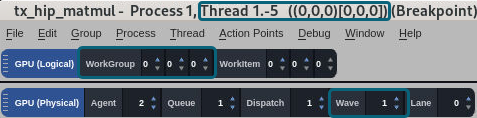
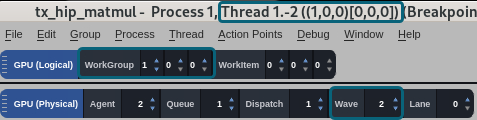
Figure 158 shows the result of changing the workgroup index from (0,0,0) to (1,0,0). The change causes the user interface to focus on wave thread 1.-2, which corresponds to physical wave 2:1:1:2.
Figure 158. Workgroup index changed from (0,0,0) to (1,0,0)