Viewing GPU Threads
Once the CUDA kernel starts executing, it will hit the breakpoint planted in the GPU code, as shown in Figure 135.
Figure 135, CUDA thread stopped at a breakpoint, focused on GPU thread <<<(0,0,0),(0,0,0)>>>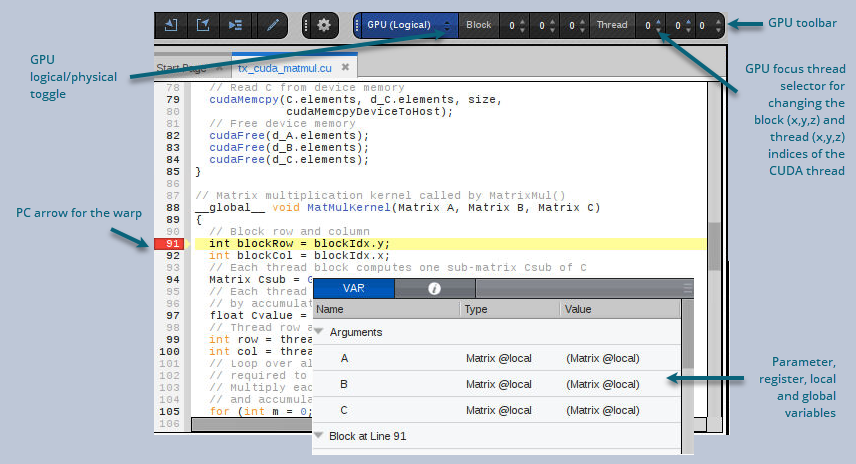
The logical coordinates of the GPU focus threads are displayed in the GPU toolbar. You can use the GPU focus thread selector to change the GPU focus thread. When you change the GPU focus thread, the logical coordinates displayed also change, and the Call Stack and Source view are updated to reflect the state of the new GPU focus thread.
The yellow PC highlighted line in the Source view shows the execution location of the GPU focus thread. The GPU hardware threads, also known as "lanes," execute in parallel so multiple lanes may have the same PC value. The lanes may be part of the same warp (up to 32 maximum threads that are scheduled concurrently), or in different warps.
The Local Variables view shows the parameter, register and local variables for the function in the selected stack frame. The variables for the selected GPU kernel code or inlined function expansion are shown.
The Call Stack shows the stack backtrace and inlined functions: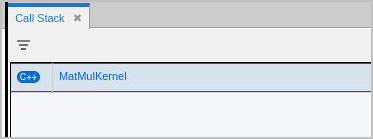
Each stack frame in the stack backtrace represents either the PC location of GPU kernel code, or the expansion of an inlined function. Inlined functions can be nested. The "return PC" of an inlined function is the address of the first instruction following the inline expansion, which is normally within the function containing the inlined-function expansion.
CUDA Thread IDs and Coordinate Spaces
TotalView gives host threads a positive debugger thread ID and CUDA threads a negative thread ID. In this example, the initial host thread in process "1" is labeled "1.1" and the CUDA thread is labeled "1.-1".
Figure 136, CUDA Thread IDs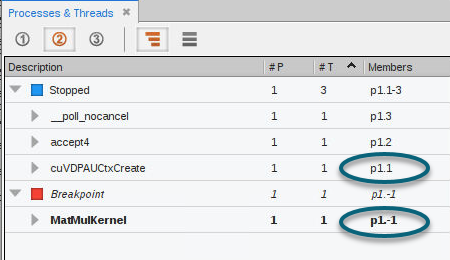
In TotalView, a "CUDA thread" is a CUDA kernel invocation consisting of registers and memory, as well as a "GPU focus thread".
Use the "GPU focus selector" on the GPU toolbar to change the physical coordinates of the GPU focus thread:
Figure 137, GPU Focus Selector on the GPU logical space toolbar
GPU Toolbars
Two GPU toolbars display the two coordinate spaces. One is the logical coordinate space that is in CUDA terms grid and block indices: <<<(Bx,By,Bz),(Tx,Ty,Tz)>>>. The other is the physical coordinate space that is in hardware terms the device number, streaming multiprocessor (SM) number on the device, warp (WP) number on the SM, and lane (LN) number on the warp.
Any given thread has both a thread index in this 4D physical coordinate space, and a different thread index in the 6D logical coordinate space. These indices are shown in the two GPU toolbars.
Figure 138, GPU logical and physical toolbars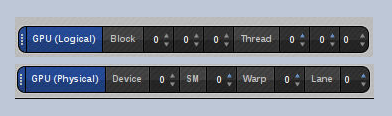
To view a CUDA host thread, select a thread with a positive thread ID in the Process and Threads view. To view a CUDA GPU thread, select a thread with a negative thread ID, then use the GPU thread selector on the logical toolbar to focus on a specific GPU thread. There is one GPU focus thread per CUDA thread, and changing the GPU focus thread affects all windows displaying information for a CUDA thread and all command line interface commands targeting a CUDA thread. In other words, changing the GPU focus thread can change data displayed for a CUDA thread and affect other commands, such as single-stepping.
Note that in all cases, when you select a thread, TotalView automatically switches the Source pane, Call Stack, Data View and Action Points view to match the selected thread.


