Viewing Array Statistics
Figure 69, The Array Statistics view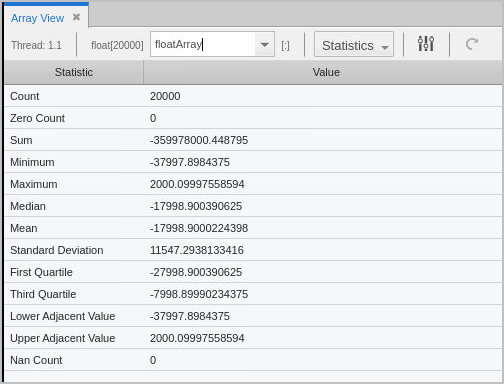
The above is a one-dimensional floating point array composed of 20,000 elements, identified under the Count statistic. See Array Statistics Detail for information on all displayed statistics.
Array statistics are also available through the CLI, as switches to the dprint command.
Cast a variable to an array | |
Slicing array data | |
Displaying arrays |
Array Statistics Detail
If you have added a slice (see Slicing Arrays), these statistics describe only the information currently being displayed; they do not describe the entire array. For example, if an array includes positive values, but a slice omits array values that are more than 0, the median value is negative even though the entire array’s real median value is more than 0.
The total number of displayed array values. If you’re displaying a floating-point array, this number doesn’t include NaN or Infinity values.
The number of elements whose value is 0.
The sum of all the displayed array’s values.
The smallest array value.
The largest array value.
The middle value. Half of the array’s values are less than the median, and half are greater than the median.
The average value of array elements.
The standard deviation for the array’s values.
Either the 25th or 75th percentile values. The first quartile value means that 25% of the array’s values are less than this value and 75% are greater than this value. In contrast, the third quartile value means that 75% of the array’s values are less than this value and 25% are greater.
This value provides an estimate of the lower limit of the distribution. Values below this limit are called outliers. The lower adjacent value is the first quartile value minus the value of 1.5 times the difference between the first and third quartiles.
This value provides an estimate of the upper limit of the distribution. Values above this limit are called outliers. The upper adjacent value is the third quartile value plus the value of 1.5 times the difference between the first and third quartiles.
A count of the number of denormalized values found in a floating-point array. This includes both negative and positive denormalized values as defined in the IEEE floating-point standard. Unlike other floating-point statistics, these elements participate in the statistical calculations.
A count of the number of infinity values found in a floating-point array. This includes both negative and positive infinity as defined in the IEEE floating-point standard. These elements do not participate in statistical calculations.
A count of the number of NaN (not a number) values found in a floating-point array. This includes both signaling and quiet NaNs as defined in the IEEE floating-point standard. These elements do not participate in statistical calculations.
A checksum value for the array elements.


