Using the Heap Report
Similar to the Leak Report, the Heap Report is based on the process in focus and includes two panes: at the top are the program’s files; at the bottom is the Backtrace pane. All entries in the Program pane identify memory allocations in the program. To locate the allocations:
1. Drill down to identify the block in which each memory allocation resides, Figure 180.
Figure 180, Heap Report: the Program Pane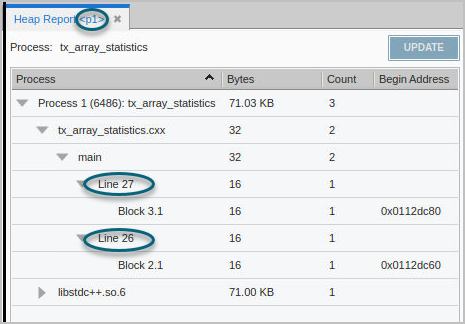
Note that:
2. Select the block to analyze, which populates the Backtrace pane with the line of code where the memory was initially allocated, and focuses on the relevant line of code in the source pane:
Figure 181, Heap Report, Backtrace pane and source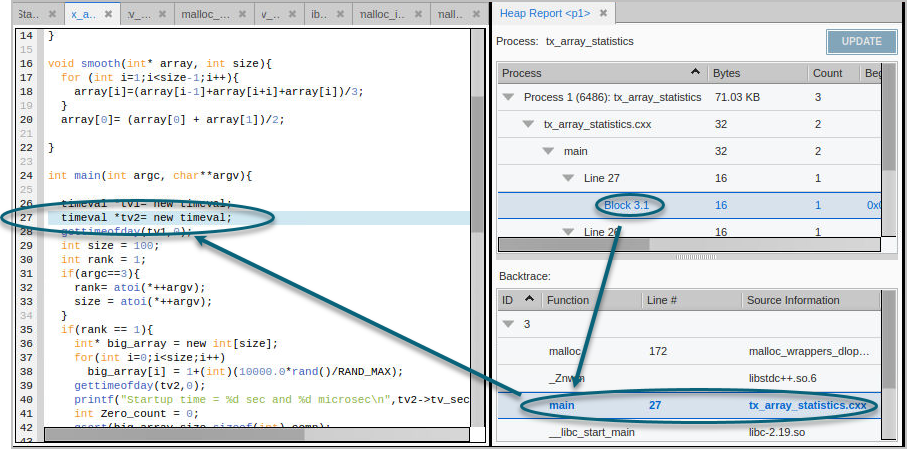
Like the Leak Report, you can navigate from both the Backtrace pane and the program pane to the relevant line in the source pane.
The Memory Report backtrace reflects the backtrace that existed when your program made the heap allocation request. The backtrace ID helps associate each block of code allocated from this line.
There is a distinction between backtraces associated with the statement and the statement in your program that allocates memory. Suppose you have a function called create_list(). This function could be called from many different places in your code, and each location will have a separate backtrace. For example, if create_list() is called from eight different places and each was called five times, there would be eight different backtraces (and eight different backtrace IDs) associated with it. Each individual backtrace would have five items associated with it.
Updating the Heap Report
If you are stepping through your code or it has stopped at a breakpoint, the Heap Report view does not update automatically. At this point, the Update button becomes active, and selecting it will update the report.


