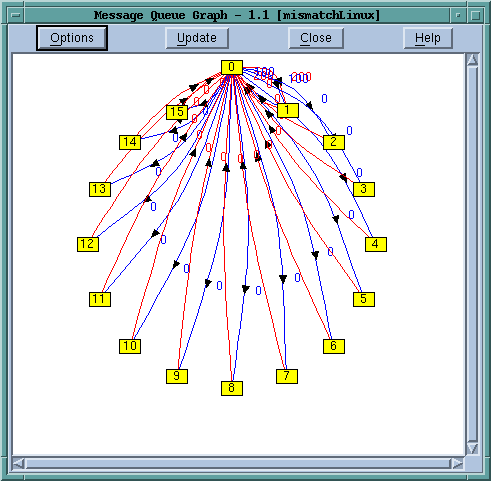
Displaying the Message Queue Graph Window
TotalView can graphically display your MPI program’s message queue state. Select the Process Window Tools > Message Queue Graph command to display a graph of the current message queue state.
 |
If you want to restrict the display, select the Options button, Figure 230.
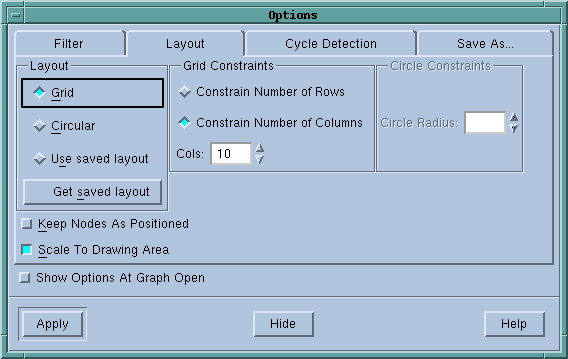 |
Here, you can alter the way in which TotalView displays ranks within this window—for example, as a grid or in a circle.
Use the commands within the Cycle Detection tab to receive reports about cycles in your messages. This is a quick and efficient way to detect when messages are blocking one another and causing deadlocks.
Perhaps the most used of these tabs is Filter.
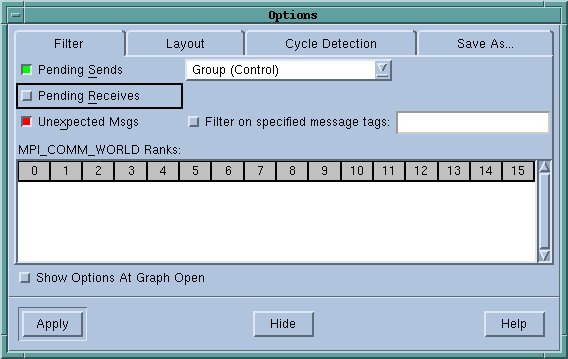 |
The button colors used for selecting messages are the same as those used to draw the lines and arrows in the Message Queue Graph Window, as follows:
You can directly select which ranks you want displayed in the lower part of the window. The Filter on specified message tags area lets you name the tags to be used as filters. Finally, you can select a group or a communicator in the group pulldown. If you have created your own communicators and groups, they appear here.
Changes made within the Options dialog box do not occur until you click Apply. The graph window then updates to reflect your changes.
The message queue graph shows your program’s state at a particular instant. Select Update to fetch new information and redraw the graph.
The numbers in the boxes within the Message Queue Graph Window indicate the MPI message source or destination process rank. Diving on a box opens a Process Window for that process.
The numbers next to the arrows indicate the MPI message tags that existed when TotalView created the graph. Diving on an arrow displays the Tools > Message Queue Window, with detailed information about the messages. If TotalView has not attached to a process, it displays this information in a grey box.
You can use the Message Queue Graph Window in many ways, including the following:


