Tools > Message Queue Graph
Displays a window that shows a graphic representation of the state of message queue information. (The Tools > Message Queue command tells TotalView to display this information in a non-graphical form.)
 |
If you right-click within the graph window, TotalView displays a context menu having the following items:
This visual display of message queue information is often used to spot unexpected messages and to uncover deadlocks. For example, if you ask TotalView to search for and display cycles—this is in the Cycle Detection tab of the Options dialog box—the display shows this problem.
You can also locate other problems. here is a procedure for displaying this information:
1. Select one or more message types to be displayed. By default, TotalView displays Unexpected messages. However, you can display any combination of Send, Receive, and Unexpected messages.
2. Select the ranks for which you want information. The ranks are displayed in the pane in the lower left corner of the window. Ranks to which TotalView is attached are displayed as yellow numbered buttons. If a button isn’t numbered, TotalView is not attached to the rank.
Use your mouse to select processes. You can either select processes individually by left-clicking on the rank number or you can use your mouse to draw a rectangle around a group of rank numbers. If you want to remove an already selected rank, click on it while pressing the Control key.
3. Select the group containing the ranks to include in the display.
4. Press the Update button.
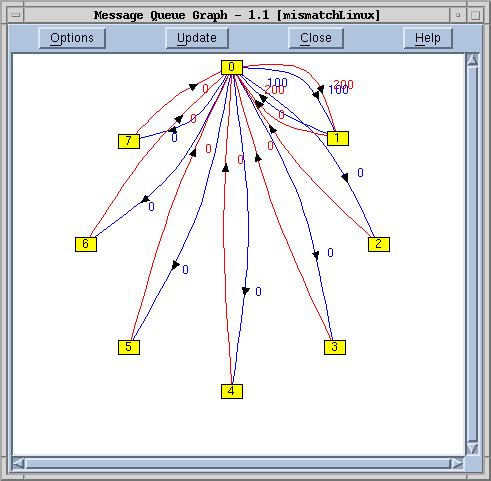
TotalView responds by displaying the message queue graph. Here, ranks are drawn as yellow boxes. The number within a box is the process’s rank.
NOTE: Wildcards are represented by a made-up process whose name is “ANY”. For example, a request such as “receive message with tag 400 from any source” means that TotalView will create a process labeled “ANY”.
The messages are indicated as curved lines with an arrow at the end. This arrow indicates the rank receiving the message. The message’s tag (or number) is displayed near the line. The line’s color represents the kind of message:
TotalView only shows MPI message queue information for processes that are halted or at a breakpoint at the time when you selected the Update button. That is, if some of your MPI processes are running when you select Update, the message queue display will be inaccurate and incomplete.
Diving
You can dive into a process or a link by double-clicking on it.
Performance Considerations
The procedure used to extract MPI information from your program can be slow. Consequently, TotalView may take a considerable time responding to your request. (The time TotalView takes is related to the number of processes being polled for information.)


