Viewing Memory Event Information
After you enable memory debugging, MemoryScape stops your program and raises an event flag if a memory problem occurs. If you are working within TotalView, TotalView also displays an event window, Figure 26. You can see the detailed information about the event either in the TotalView event window or by clicking on the MemoryScape event flag.
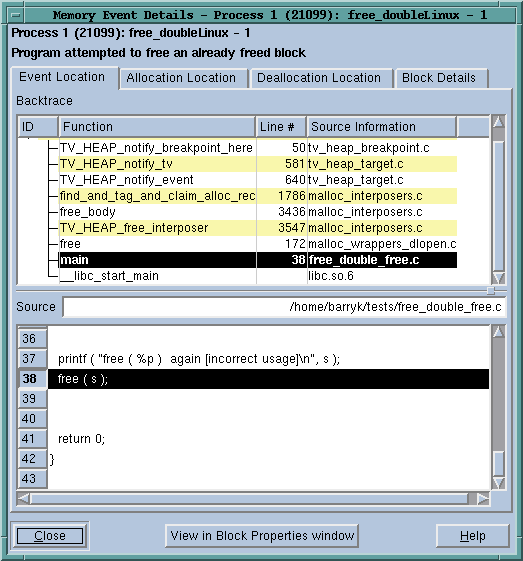
The details include the backtrace — that is, a list of stack frames — that existed when your program caused the memory error. Clicking on a stack frame shows the corresponding source code. The other tabs let you further explore where the memory block was allocated and deallocated. You can also see the contents of the block in the Block Details tab.
 |
MemoryScape error notification | |
Halting execution at a memory error | |


