Memory Debugging
TotalView has a fully integrated version of the MemoryScape product for debugging memory issues. MemoryScape is also available as a standalone product.
MemoryScape can monitor how your program uses malloc() and free() and related functions such as calloc() and realloc(). You must enable memory debugging before you start running your program. Here are three ways to enable memory debugging:
Once you have loaded a program to debug in TotalView, select Debug > Open MemoryScape to launch the primary MemoryScape window.
 |
Because MemoryScape monitors calls to the malloc API, you can even debug programs that use their own memory management libraries. The only requirement is that these libraries eventually use the API. In most cases, you don’t need to recompile or relink your program to use MemoryScape.
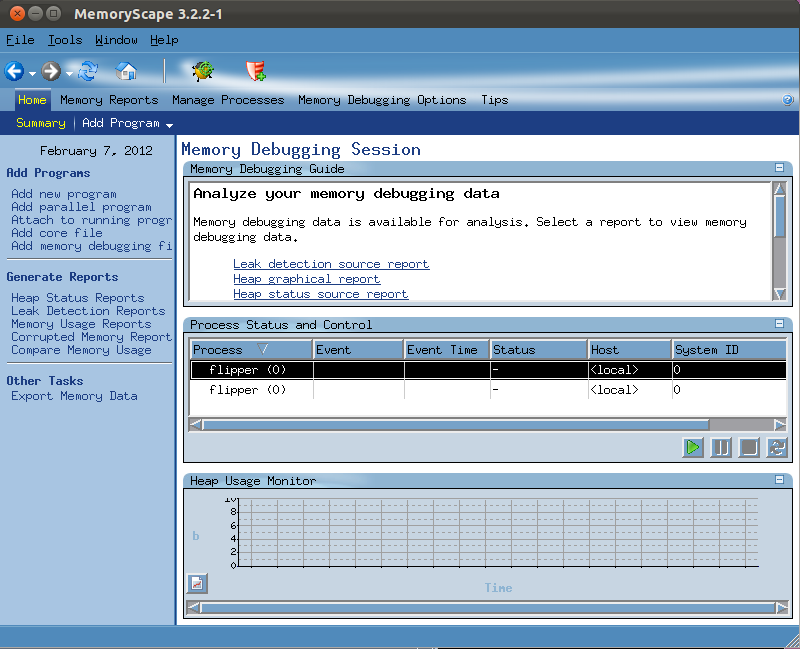
Using MemoryScape | Use of MemoryScape is explained in a separate document, Debugging Memory Problems with MemoryScape, however this section introduces a few key features. |


