Memory Comparison Report
Use the Memory Comparison Report to compare memory state. You can compare the memory state of an executing program against a saved memory state or you can compare two saved memory states.
For information on saving memory states, see Export Memory Data. For information on importing this information back into MemoryScape, see Add Memory Debugging File and “Task 13: Comparing Memory.”
Move your cursor over the graphic to obtain help.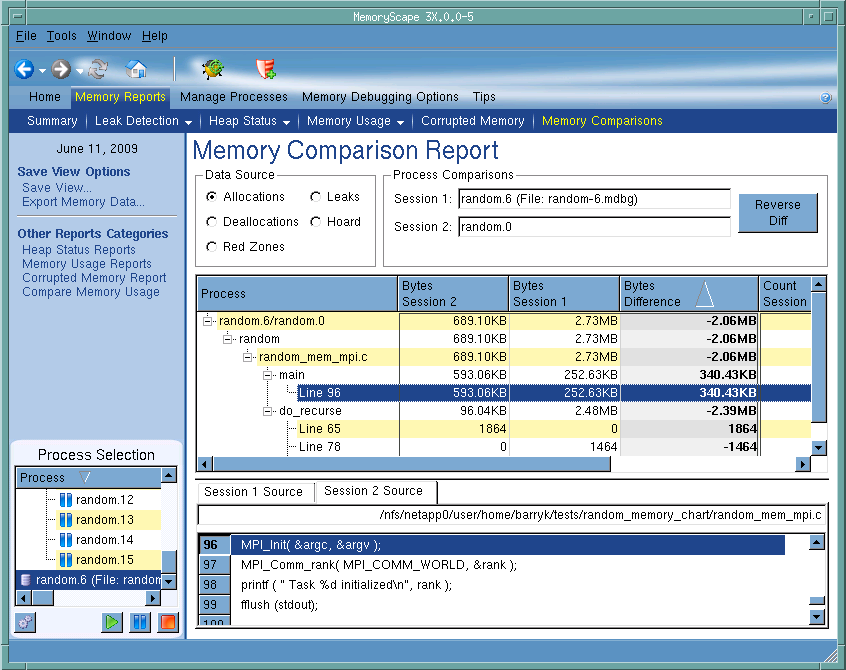
Data Source
Tells MemoryScape what kinds of memory you want to compare. Your choices are Allocations, Deallocations, Leaks, the Hoard and Red Zones. You can only select one data source at a time. If you need to repeatedly refer from one to another, you may want to use the Save View command (it’s on the left side of the screen) to write an HTML version of the view to disk.
Process Comparisons
Shows you the order in which MemoryScape will make the comparison. Many users prefer an order of older-to-newer, but it is really a matter of personal preference.
If you want to change the order in which this comparison is made, click the Reverse Diff button  .
.
.Reverse Diff
Click this button to change the order in which MemoryScape compares your two files.
Process area
The process area contains a source report of your program. Information on this area is below this figure.
Session Sources
Shows the name of the file and the source code line within that file for the line selected in the central process area. You can see this information for either process by selecting either Session 1 Source or Session 2 Source.
Process Selection
Shows the process and files being used for the comparison. The symbol to the left of the process name tells you the process’ execution status or if it is a memory debugging file—this is indicated by a disk symbol ( ).
).
).Execution controls
These controls let you refresh or create ( ) this report, run (
 ), or halt (
 ) your program.
), or halt () your program.The central process area organizes the information being examined by your program’s sources. That is, it lists your program’s files and the routines contained within these files. Next to each name, whether it is the name of your process, a file, or a routine, is the comparison information. Initially, MemoryScape only shows the files in your process. You will need to expand the entries to see more information. Do this by clicking the + symbol. Clicking the - symbol collapses the entry so that you see less information.
The following lists discusses the information contained within this area. If some of the columns being discussed aren’t visible, you can either resize column widths to use less space or make your window larger.
Process
This column organizes your program hierarchically. The root of the hierarchy is your process. Beneath it are the files that contain your program. The next level are the routines contained within files. At the lowest level is the line number within the file.
Bytes Session 2
Contains the number of bytes for the selected Data Source for session 2 for the associated process, file, routine, or line.
Bytes Session 1
Contains the number of bytes for the selected Data Source for session 1 for the associated process, file, routine, or line.
Bytes Difference
Shows the result of subtracting the previous two columns.
Count Session 2
Shows the number of elements that are contained within the byte description for session 2.
Count Session 1
Shows the number of elements that are contained within the byte description for session 1.
Count Difference
Shows the result of subtracting the previous two columns
Debug in TotalView
Tells MemoryScape to open the currently selected process in TotalView. The TotalView process window will display the current state of that process. You must have a TotalView license available to debug in TotalView.
Be aware that opening the TotalView process window from within MemoryScape does not initialize TotalView in the same way as starting TotalView directly. The definitions in your .tvdrc file and your saved breakpoints are not loaded. However, you can load a breakpoint file using the Action Point menu item in the process window. If you need the definitions in your .tvdrc file, start TotalView first and open MemoryScape from within TotalView.
Red Zones
Tells MemoryScape to set the Red Zones option on or off for the selected processes.


