Export Memory Data
Use the Export Memory Data command, which is found on the left side of many screens, to write memory state data to a file. At a later time, you can use the Add Memory Debugging File command to import this information back into MemoryScape.
MemoryScape can use imported memory state information in exactly the same way as the memory state information for an executing process.
Move your cursor over the graphic to obtain help.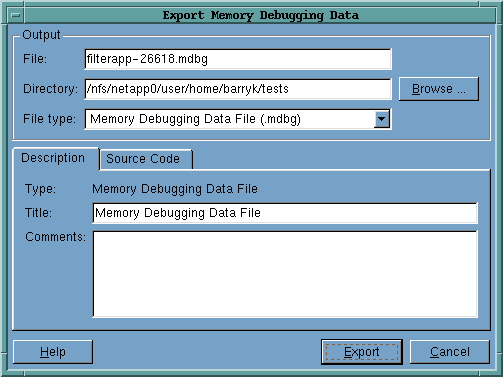
File
Names the memory debugging files that MemoryScape will write. While MemoryScape provides a default name, you can change it. MemoryScape appends an .mdbg suffix to these files. MemoryScape writes these files to the directory displayed within the Directory text field that immediately follows.
If you are exporting a multiprocess program, MemoryScape places information for each process in its own file. For example, if the file name you enter is monte_carlo, MemoryScape appends a process number to each file so that it is writing files named monte_carlo0, monte_carlo1, and so on.
Directory
Names a directory into which MemoryScape writes its memory debugging files. If you want MemoryScape to write the files elsewhere, just type over what appears here. As an alternative, click the Browse button to the right and use the controls within the displayed dialog box to select a directory.
File type
Tells you the kind of information that MemoryScape is about to write.
Description
Selecting this tab displays the type of information of contained within the file and information you can add that lets you identify the information in this file.
Source Code
After selecting this tab, you can control the quantity of source code information that MemoryScape writes into the memory debugging file.
Type
Tells you the kind of information that MemoryScape is about to write.
Title
Contains text that MemoryScape writes into the memory debugging file. After you import the file back into MemoryScape, you can see this information in the Properties dialog box. (You can display this dialog box by right-clicking on a process from within a MemoryScape screen and selecting Properties.)
Comments
Enter information that will help you identify the contents. For example, if you will be saving five different debugging files, this information can tell you which is which. After you import the file back into MemoryScape, you can see this information in the Properties dialog box. (You can display this dialog box by right-clicking on a process from within a MemoryScape screen and selecting Properties.)
Export
Clicking this button tells MemoryScape to write the memory debugging file.
The controls within the Source Code tab let you control the amount of source code information saved within the memory debugging file. If you do not have much disk space or the file to be written is large (you’ll be able to tell how large files will be after you write some files), you may want to decrease the number of lines of code. While you can tell MemoryScape that it shouldn’t write source information, you may be making it harder to find where a problem occurs in your program.
Move your cursor over the graphic to obtain help.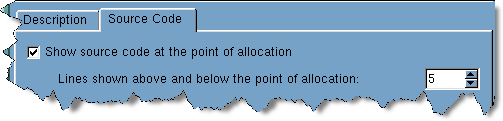
Show source code at the point of allocation
When selected, MemoryScape writes source code information into memory debugging files. “Selected” is the default, and you should leave it selected unless disk space is very limited or the time to write a file is excessive.
Lines shown above and below the point of allocation
This value controls how many lines of source code MemoryScape writes into the memory debugging file. These lines help you identify where allocations occur within your program. Our experience is that 5 lines above and below the allocation is sufficient for identifying where you are and the context for the statement allocating a memory block.


