Add Memory Debugging File
Use this screen to bring a previously saved memory debugging file into the current session. After MemoryScape reads in this file, it can create reports in the same way as it does for a live process.
Use the Export Memory Data command found on the left side of many screens to create this file.
Move your cursor over the graphic to obtain help.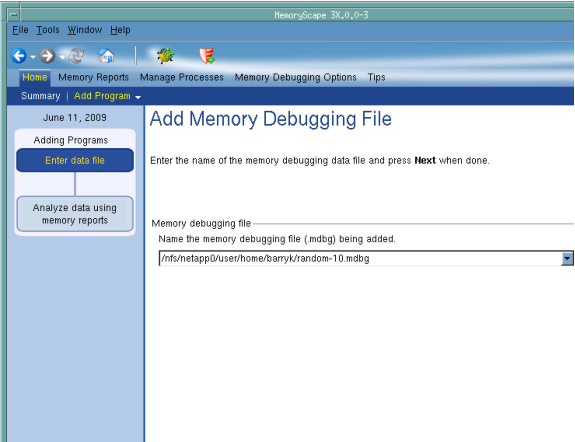
Adding Programs
This chart shows how many steps are involved in adding a memory debugging file and where you are in this process.
Memory Debugging File
You can either type the name of the memory debugging file or look for it in the file system by clicking the Browse button. The path to this file can either be relative to the place in the file system from which you started MemoryScape or it can be an absolute file name. For example, you could either type my_progs/a_program.mdbg or /home/me/my_progs/a_program.mdbg.
Debug in TotalView
Tells MemoryScape to open the currently selected process in TotalView. The TotalView process window will display the current state of that process. You must have a TotalView license available to debug in TotalView.
Be aware that opening the TotalView process window from within MemoryScape does not initialize TotalView in the same way as starting TotalView directly. The definitions in your .tvdrc file and your saved breakpoints are not loaded. However, you can load a breakpoint file using the Action Point menu item in the process window. If you need the definitions in your .tvdrc file, start TotalView first and open MemoryScape from within TotalView.
Red Zones
Tells MemoryScape to set the Red Zones option on or off for the selected processes.


