Programs and Memory
When you run a program, your operating system loads the program into memory and defines an address space in which the program can operate. For example, if your program is executing in a 32-bit computer, the address space is approximately 4 gigabytes.
NOTE >> This discussion is generally relevant to most computer architectures. For information specific to your system, check your vendor documentation. |
An operating system does not actually allocate the memory in this address space. Instead, operating systems
memory map this space, which means that the operating system relates the theoretical address space your program could use with what it actually will be using. Typically, operating systems divide memory into pages. When a program begins executing, the operating system creates a map that correlates the executing program with the pages that contain the program’s information.
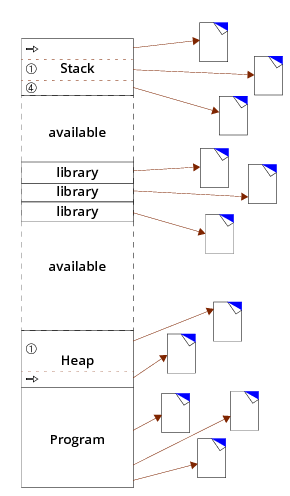
Figure 1 shows regions of a program where arrows point to the memory pages that contain different portions of your program.
Figure 1 also shows a stack containing three stack frames, each mapped to its own page.
Similarly, the heap shows two allocations, each mapped to its own page. (This figure vastly simplifies actual memory mapping, since a page can have many stack frames and many heap allocations.)
The program did not emerge fully formed into this state. It had to be compiled, linked, and loaded.
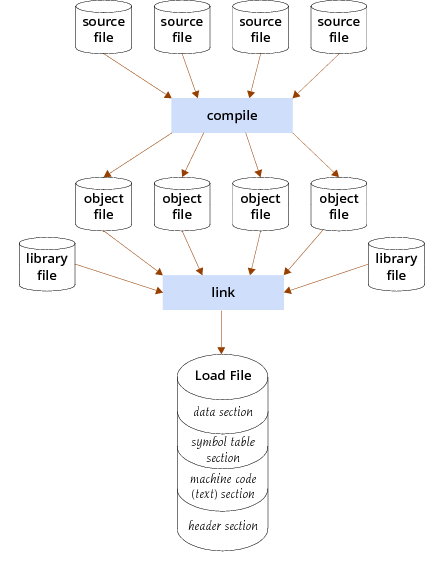
Figure 2 shows a program whose source code resides in four files.
Running these files through a compiler creates object files. A linker then merges these object files and any external libraries needed into a load file. This load file is the executable program stored on your computer’s file system.
When the linker creates the load file, it combines the information contained in each of the object files into one unit. Combining them is relatively straightforward. The load file at the bottom of
Figure 2 also details this file’s contents, as this file contains a number of sections and additional information. For example:
• Data section—contains static variables and variables initialized outside of a function. Here is a small sample program that shows these initializations:
int my_var1 = 10;
void main ()
{
static int my_var2 = 1;
int my_var3;
my_var3 = my_var1 + my_var2;
printf(“here’s what I’ve got: %i\n”, my_var3);
}
The data section contains the my_var1 and my_var2 variables. In contrast, the memory for the my_var3 variable is dynamically and automatically allocated and deallocated within the stack by your program’s runtime system.
• Symbol table section—contains addresses (usually offsets) to the locations of routines and variables.
• Machine code section—contains an intermediate binary representation of your program. (It is intermediate because the linker has not yet resolved the addresses.)
• Header section—contains information about the size and location of information in all other sections of the object file.
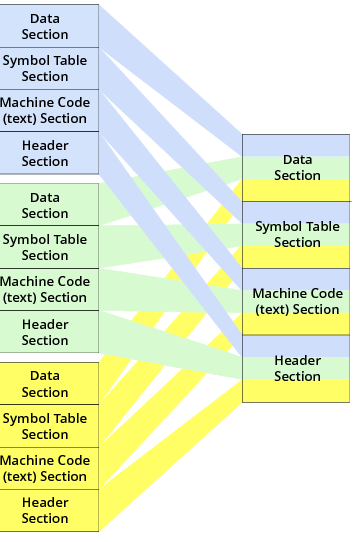
When the linker creates the load file from the object and library files, it interweaves these sections into one file. The linking operation creates something that your operating system can load into memory.
Figure 3 shows this process.
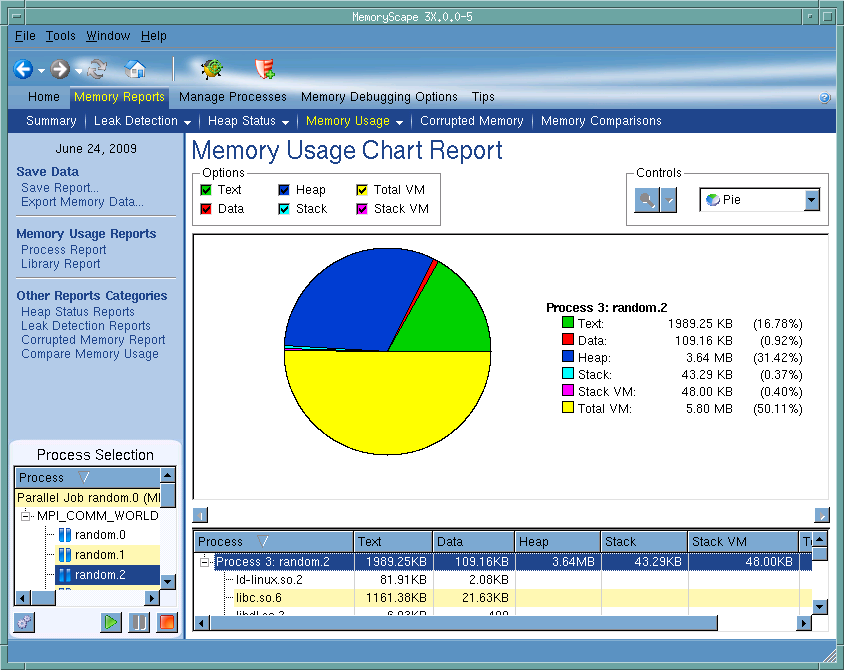
MemoryScape can provide information about these sections and the amount of memory your program is using. To obtain this information, use the
Memory Reports | Memory Usage and select
Chart report,
Figure 4.
While there are other memory usage reports, the Chart Report provides a concise summary of how your program is using memory.
