Displaying Fortran Parameters
A Fortran PARAMETER defines a named constant. If your compiler generates debug information for parameters, they are displayed in the same way as any other variable. However, some compilers do not generate information that TotalView can use to determine the value of a PARAMETER. This means that you must make a few changes to your program if you want to see this type of information.
If you’re using Fortran 90, you can define variables in a module that you initialize to the value of these PARAMETER constants; for example:
INCLUDE ‘PARAMS.INC’
MODULE CONSTS
SAVE
INTEGER PI_C = PI
...
END MODULE CONSTS
The PARAMS.INC file contains your parameter definitions. You then use these parameters to initialize variables in a module. After you compile and link this module into your program, the values of these parameter variables are visible.
If you’re using FORTRAN 77, you can achieve the same results if you make the assignments in a common block and then include the block in main(). You can also use a block data subroutine to access this information.
Displaying Thread Objects
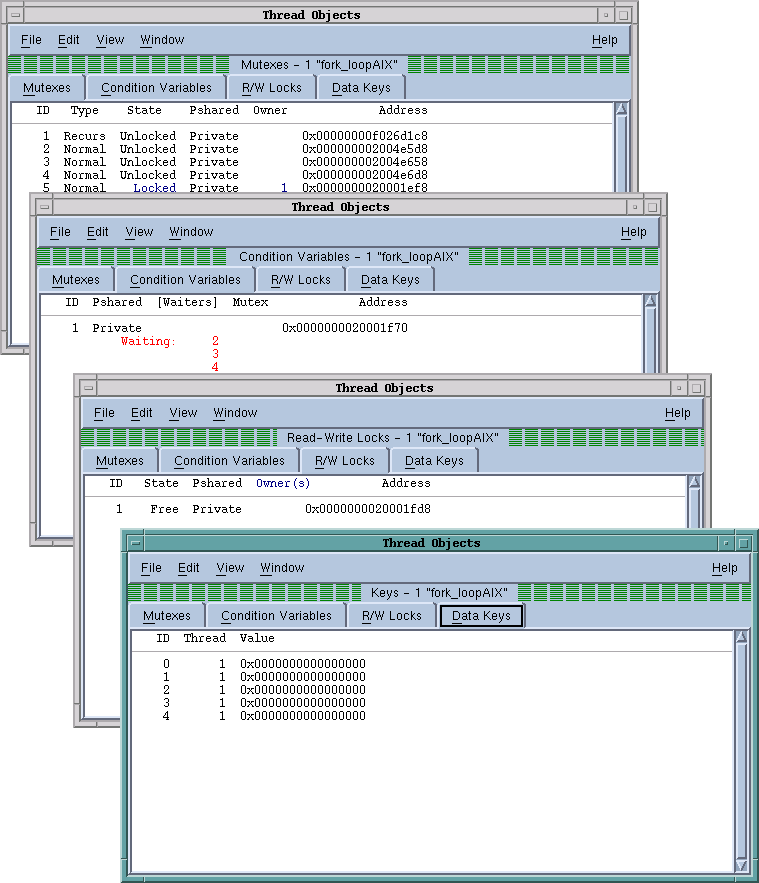
On IBM AIX systems, TotalView can display information about mutexes and conditional variables, read/write locks and data keys. You can obtain this information by selecting the
Tools > Thread Objects command. After selecting this command, TotalView displays a window that contains four tabs.
Figure 150 shows examples based on AIX.
Diving on any line in these windows displays a Variable Window that contains additional information about the item. Some notes:
• If you’re displaying data keys, many applications initially set keys to 0 (the NULL pointer value). TotalView doesn’t display a key’s information, however, until a thread sets a non-NULL value to the key.
• If you select a thread ID in a data key window, you can dive on it using the View > Dive Thread and View > Dive Thread in New Window commands to display a Process Window for that thread ID.
The
online Help contains information on the contents of the displayed windows.

