Totalview® Getting Started Guide : Getting Started with TotalView Products : The Basics : Starting TotalView and Creating a Debugging Session : Managing Debugging Sessions
Managing Debugging Sessions
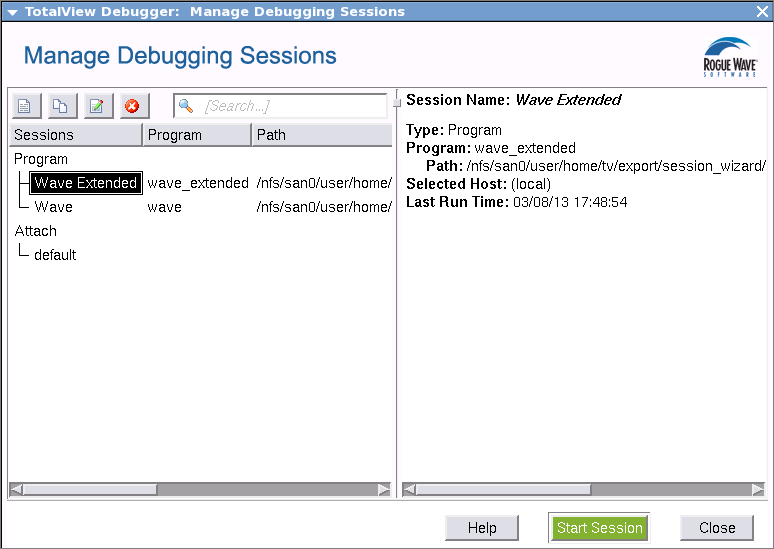
In the Sessions Manager, select the Manage Sessions button to launch the Manage Debugging Sessions dialog.
 
Figure 3 – Manage Debugging Sessions
This dialog displays previously configured debugging sessions. From here, you can edit, duplicate, or delete a session, as well as view its configuration. In addition, you can start a debugging session using the green Start Session button.
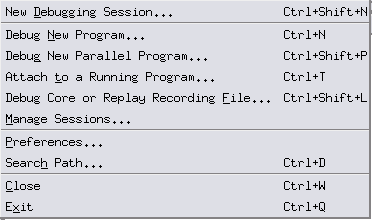
You can also access the Sessions Manager via File > Manage Sessions on both the Root and Process windows.
 
Figure 4 – Root Window, File > Manage Sessions
 
RELATED TOPICS 
 
The Sessions Manager
Managing Sessions” in the TotalView User Guide
Additional ways to start TotalView
Starting TotalView” in the TotalView User Guide
Command line syntax for the totalview command
TotalView Command Syntax” in the TotalView Reference Guide
Compiling your program for debugging
“Compiling Programs” in the TotalView User Guide
Loading a program into TotalView using either the GUI or the CLI
Loading Programs from the Sessions Manager” in the TotalView User Guide
Attaching an existing process
Attaching to a Running Program” in the TotalView User Guide
Debugging a core file
Debugging a Core File” in the TotalView User Guide
Starting a parallel debugging job
Debugging a replay recording session file
Debugging a Replay Recording Session” in the TotalView User Guide