The Root and Process Windows
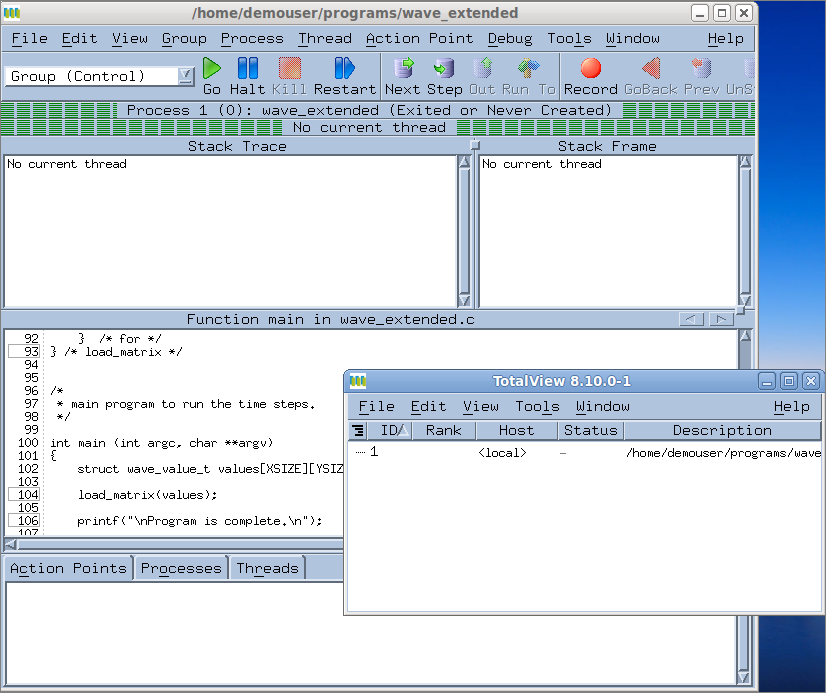
At startup, TotalView launches its two primary windows, the Root Window and the Process Window. With these two windows, you can navigate through the various elements of your program.
The Root Window
The Root Window (the smaller window above) lists all processes and threads under TotalView control. Associated with each is a name, location (if a remote process), process ID, status, and a list of executing threads within any processes.
Since the program has been created but not yet executed, there is just a single process listed, with zero threads.
The Process Window
The Process Window displays a wide range of information about the state of a process and its individual threads.

The Stack Trace pane displays the call stack with any active threads. Currently, it displays “No current thread” since nothing is running.

The Stack Frame pane displays information on the current thread’s variables.

The Source Pane displays source code for the
main() function. Note that the pane’s header reports its focus as being in
main():

The three tabs Action Points, Processes, and Threads display any set action points, any processes within the current control group, and a list of all active threads in the process.
The program wave_extended does not contain multiple threads or processes, so the last two tabs will display just a single process and thread.


