TotalView CUDA Debugging Model
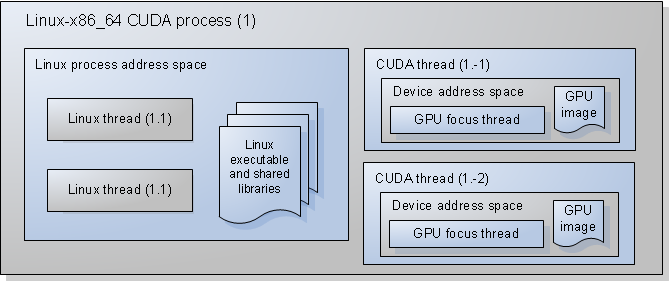
Figure 241 shows the TotalView CUDA debugging model for a Linux process consisting of two Linux pthreads and two CUDA threads. A CUDA thread is a CUDA kernel invocation that is running on a device.
A Linux-x86_64 CUDA process consists of:

A Linux process address space, containing a Linux executable and a list of Linux shared libraries.

A collection of Linux threads, where a Linux thread:

Is assigned a positive debugger thread ID.

Shares the Linux process address space with other Linux threads.

A collection of CUDA threads, where a CUDA thread:

Is assigned a negative debugger thread ID.

Has its own address space, separate from the Linux process address space, and separate from the address spaces of other CUDA threads.

Has a "GPU focus thread", which is focused on a specific hardware thread (also known as a core or "lane" in CUDA lingo).
The above TotalView CUDA debugging model is reflected in the TotalView user interface and command line interface. In addition, CUDA-specific CLI commands allow you to inspect CUDA threads, change the focus, and display their status. See the dcuda entry in the TotalView Reference Guide for more information.

