Starting TotalView
TotalView can debug programs that run in many different computing environments using many different parallel processing modes and systems. This section looks at few of the ways you can start TotalView. See the
“TotalView Command Syntax” chapter in the
TotalView Reference Guide for more detailed information.
In most cases, the command for starting TotalView looks like the following:
totalview [ executable [ corefiles ] ] [ options ]
where executable is the name of the executable file to debug and corefiles is the name of one or more core files to examine.
CLI: totalviewcli [ executable [ corefiles ]] [ options ] |
Your environment may require you to start TotalView in another way. For example, if you are debugging an MPI program, you must invoke TotalView on
mpirun. For details, see
Chapter 19, “Setting Up Parallel Debugging Sessions,” .
Note that you can use the GUI and the CLI at the same time. Use the
Tools > Command Line command to display the CLI’s window.

Your installation may have its own procedures and guidelines for running TotalView.
The following examples show different ways that you might begin debugging a program:
Starting TotalView
totalview
Starts TotalView without loading a program or core file. Instead, TotalView displays its
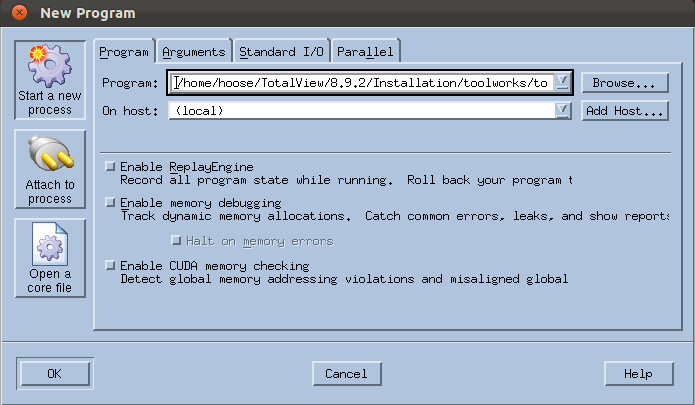
File > New Program dialog box to enter information to load your program,
Figure 25.
On the CLI, enter:
CLI: totalviewcli then dload executable |
In the GUI, notice the checkboxes on the Program tab. These enable reverse debugging with ReplayEngine and memory debugging and notifications using MemoryScape to stop executing when memory events occur.
Starting on Mac OS X
If you installed TotalView on a Macintosh using the application bundle, you can click on the TotalView icon. If you’ve installed the .dmg version, you can start TotalView from an xterm by typing:
installdir/TotalView.app/totalview
where installdir is where TotalView is installed.
If TotalView was installed on your system without procmod permission, you will not be able to debug programs. If TotalView detects this problem, it displays a dialog box with information on how to fix it.
Debugging a program
totalview executable
Starts TotalView and loads the executable program.
CLI: totalviewcli executable |
If you installed TotalView on a Macintosh using the application bundle, you can drag your program’s executable to the TotalView icon on your desktop.
If you type an executable name, TotalView remembers that name and many of its arguments.
Debugging a core file
totalview executable corefiles
Starts TotalView and loads the executable program and the corefile core file.
CLI: dattach -c corefiles -e executable |
The corefiles argument represents one or more core files associated with this executable. You can use wild cards in the core file name.
Passing arguments to the program being debugged
totalview executable -a args
Starts TotalView and passes all the arguments following the
-a option to the
executable program. When using the
-a option, it must be the last TotalView option on the command line.
CLI: totalviewcli executable -a args |
If you don’t use the
-a option and you want to add arguments after TotalView loads your program, add them either using the Arguments tab within the
File > New Program dialog box or use the
Process > Startup command.
CLI: dset ARGS_DEFAULT {value} |
Debugging a program that runs on another computer
totalview executable -remote hostname_or_address[:port]
Starts TotalView on your local host and the tvdsvr on a remote host. After TotalView begins executing, it loads the program specified by executable for remote debugging. You can specify a host name or a TCP/IP address. If you need to, you can also enter the TCP/IP port number.
CLI: totalviewcli executable
-r hostname_or_address[:port] |
If TotalView fails to automatically load a remote executable, you may need to disable
autolaunching for this connection and manually start the
tvdsvr. (
Autolaunching is the process of automatically launching
tvdsvr processes.) To disable autolaunching, add the
hostname:portnumber suffix to the name entered in the
Host field of the
File > New Program dialog box. As always, the
portnumber is the TCP/IP port number on which TotalView server is communicating with TotalView. See
“Starting the TotalView Server Manually” for more information.

TotalView Individual does not allow remote debugging.
Debugging an MPI Program
totalview executable
(method 1) In many cases, you can start an MPI program in much the same way as you would start any other program. However, you need to select the Parallel tab within the File > New Programs dialog box, and the MPI version in addition to other options.
mpirun -np count -tv executable
(method 2) The MPI mpirun command starts the TotalView executable pointed to by the TOTALVIEW environment variable. TotalView then starts your program. This program runs using count processes.
Using gnu_
debuglink Files
totalview executable
If you have prepared a
gnu_debuglink file, TotalView can access this information. For more information, see
“Using gnu_debuglink Files” within the
Compilers and Platforms chapter of the
TotalView Reference Guide.
