Fixing Dangling Pointer Problems
| You must be using MemoryScape with TotalView to be able to find dangling pointers. |
Fixing dangling pointer problems is usually more difficult than fixing other memory problems. First of all, you become aware of them only when you realize that the information your program is manipulating isn’t what it is supposed to be. Even more troubling, these problems can be intermittent, happening only when your program’s heap manager reuses a memory block. For example, if nothing else is running on your computer, your program may never reuse the block. If there are a large number of jobs running, it could reuse a deallocated block quickly.
After you identify that you have a dangling pointer problem, you have two problems to solve. The first is to determine where your program freed the memory block. The second is to determine where it should free this memory. MemoryScape tools that can help you are:
 Block painting
, in which MemoryScape writes a bit pattern into allocated and deallocated memory blocks.
 Hoarding
, in which MemoryScape holds onto a memory block when the heap manager receives a request to free it. This is most often used to get beyond where a problem occurs. By allowing the program to continue executing with correct data, you sometimes have a better chance to find the problem. For example, if you also paint the block, it becomes easy to tell what the problem is. In addition, your program might crash. (Crashing while you are in TotalView is a good thing, because it will show the crash point, and you will immediately know where the problem is.)
 Watchpoints
, in which TotalView stops execution when a new value is written into a memory block. If MemoryScape is painting deallocated blocks, you immediately know where your program freed the block.
 Block tagging
, in which TotalView stops execution when your program deallocates or reallocates memory.
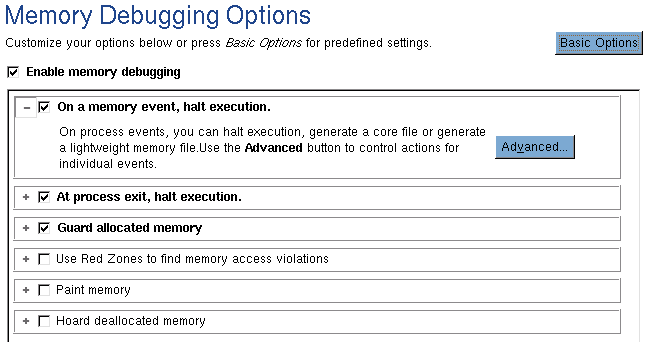
You enable painting and hoarding in the Memory Debugging Options Page,
Figure 24.
You can turn painting and hoarding on and off. In addition, you can tell MemoryScape what bit patterns to use when it paints memory. For more information, see
“Block Painting”.
