Examining and Editing Data
Diving and Viewing Data
Diving is integral to the TotalView GUI and provides a quick, intuitive, and effective way to get more information about various program elements. Diving is usually performed by just double-clicking on an element and generally launches a window with more information. You can dive on variables of course, but also on processes and threads, the call stack, functions, and source code.
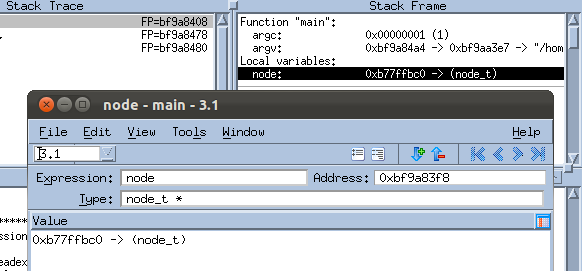
To dive on a variable, just double-click on it or highlight it and select
View > Dive to launch a Variable Window,
Figure 11.
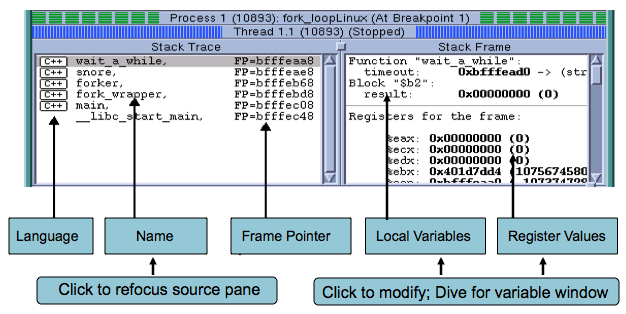
Local variables are visible in the Stack Frame as in
Figure 11, while global variables are available in the Source Pane.
In the Source Pane, if a global variable or function can be dived on, a red dotted box appears when your cursor hovers over it,
Figure 12.
For example, the Stack Frame Pane in the Process Window contains the current call stack. When you dive on a routine, TotalView shows the routine in the Source Pane and its variables in the Stack Frame Pane.
TotalView provides several other ways to see more detail about any aspect of your program:
 Displaying the call graph
:
Use Tools > Call Graph to launch a dynamic diagram that shows all the currently active routines. Click Update to recreate this display in a running program
 Viewing the state of every process and thread
:
Use Tools > Parallel Backtrace View to view the status of thousands of processes from a single window.
 Viewing your array data graphically
:
Use the Variable Window’s Tools > Visualize to view array data as a graph or in the Visualizer, a versatile, stand-alone program that can be launched directly from within TotalView or separately via the command line.
See More


