When selected (and we recommend that you leave it selected), MemoryScape halts your program’s execution just before it detects that a problem will occur when your program calls a function in the malloc library.
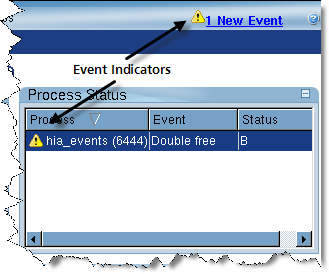
When your program allocates memory, MemoryScape records this and other information in an internal table. Every time your program deallocates or reallocates memory, it checks what is about to be done against this information. If it detects that a problem will occur, it stops execution and displays an event indicator, shown inFigure 43.
|
Figure 43: Event Indicators
|
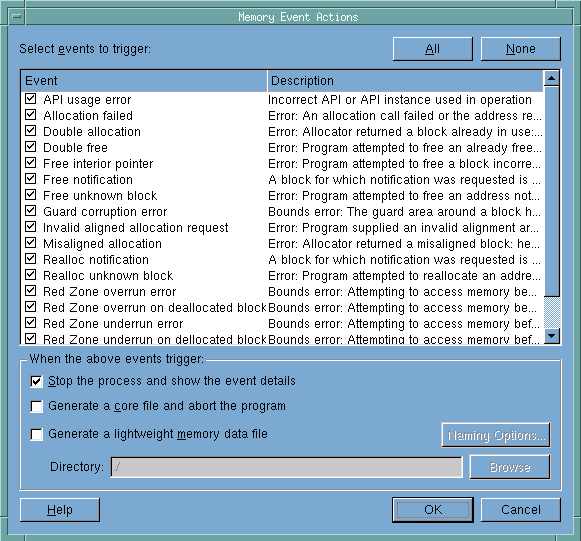
MemoryScape can watch for a number of events. Its default is to watch for all, but you can specify specific events to watch by selecting the Advanced button which launches the Memory Event Actions Dialog Box, Figure 44.
|
Figure 44: Memory Event Actions Dialog Box
|
|
This snapshot was created using TotalView Debugger Team and Team Plus. If you are not licensed for these products, then the two options Generate a core file and abort the program and Generate a lightweight memory data file are unavailable.
|
In most cases, you would want to unselect an event if it is coming from a library or system you can’t control.
The Generate a core file and abort the program and Generate a lightweight memory data file let you tell MemoryScape that it should write a file when the event occurs. If you tell MemoryScape to generate a core file, MemoryScape writes the file to disk and aborts execution. (The operating system routines that generate a core file cause the program to be aborted.) As you are still within MemoryScape, you can restart your program.
The second kind of file that MemoryScape can write is a lightweight memory file. This file is similar to the file that the MemoryScape writes when you use the File > Export command. These files can then be read back into the MemoryScape in the same way that it can read in the exported .dbg files. In contrast to a core file, your program continues to execute after the MemoryScape writes the file.
If Stop the process and show the event details preference is selected, the event details window that is displayed will have buttons that let you generate a core file or lightweight memory file.
When generating a lightweight memory file, you can name the directory into which the MemoryScape writes the file by naming the location in the Directory field. As an alternative, use the Browse button to navigate to a directory.
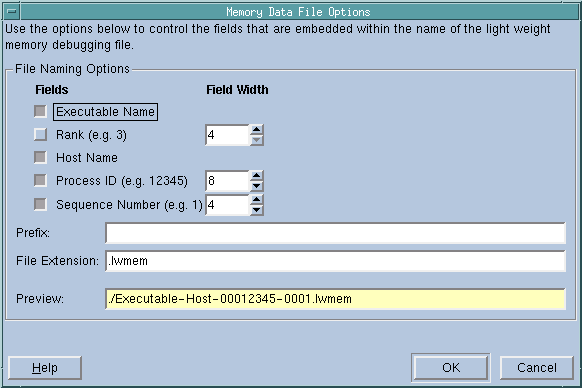
You can indicate the way the MemoryScape names this file by pressing the Naming Options dialog box, Figure 45.
|
Figure 45: Memory Data File Options
|
As you select options in this dialog box, the MemoryScape previews what the file name looks like in the Preview area.


