Programmers use print statements as an easy way to examine data, usually because their debugger doesn’t have sophisticated ways of showing information. In contrast, Chapter 14, “Examining and Changing Data” and Chapter 15, “Examining Arrays” explain how TotalView displays data values. In addition, Chapter 9, “Visualizing Programs and Data” describes how TotalView visualizes your data graphically.
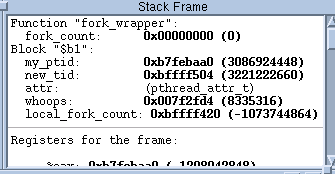
Because data is difficult to see, the Stack Frame Pane, the pane in the upper right corner of the Process Window (see Figure 4), lists all variables that exist in your current routine. If a variable’s value is simple, it is visible here.
|
|
You can “dive” almost everywhere in TotalView. Depending on where you are, diving either brings you to a different place in your program or displays more information about the object of the dive. To dive, position the cursor over the item and click the middle mouse button or double-click the left mouse button.
|
For example, diving on a variable displays a window that contains information about the variable, while diving on a routine replaces the current contents with the source lines from the selected routine.
Some values in the Stack Frame Pane are in bold, Figure 4. This lets you know that you can click on the value and then edit it.
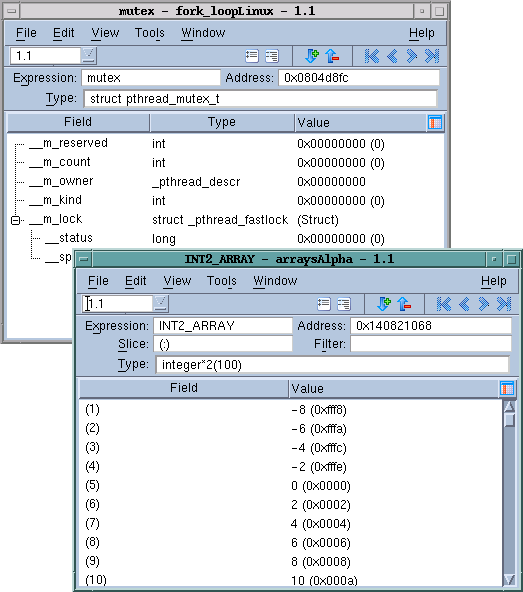
Figure 5 shows two Variable Windows, one created by diving on a structure and the second by diving on an array.
Because the data displayed in a Variable Window might not be simple, you can redive on this data. When you dive in a Variable Window, TotalView replaces the window’s contents with the new information. If you don’t want to replace the contents, you can use the View > Dive Thread in New Window command to display this information in a separate window.
If the displayed data is a pointer, diving on the variable dereferences the pointer and then displays the data pointed to. In this way, you can follow linked lists.
The upper right corner of a Variable Window has arrow buttons ( ). Selecting these buttons undives and redives. For example, if you’re following a pointer chain, click the center-left-pointing arrow to go back to where you just were. Click the center-right-pointing arrow to go forward. The outermost two arrows do “undive all” and “redive all” operations.

