Visualizing Array Data
To visualize your data, choose either the Histogram or the Line Plot
  view.
view.
Different datasets can require different views to display their data. For example, you could use a histogram to see the distribution of a dataset, or lines to view trends or slope.
Histogram view
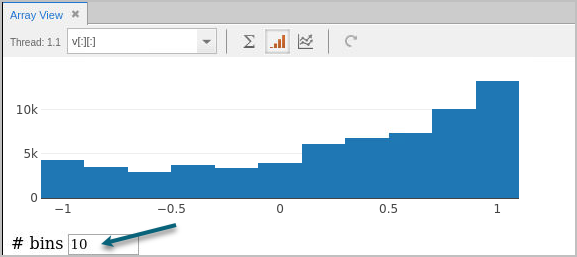
By default, the view displays 10 bins, or buckets:
 |
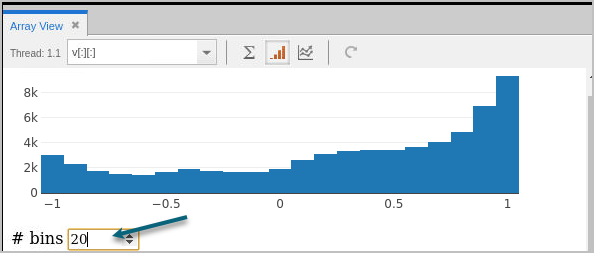
Change the number of bins to evaluate a different dataset distribution:  |
The Line Plot view
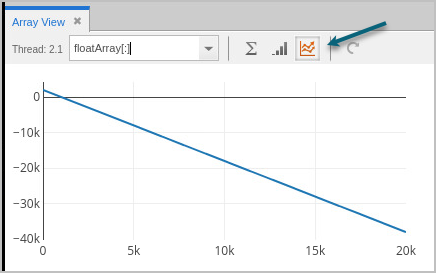
To display your data as x and y coordinate pairs, use the Line Plot view. This view is useful to plot trend lines in your one-dimensional datasets. For example:
Figure 75, Array Data > Line Plot

Note that for higher-dimensional datasets in the Array View, the Line Plot displays a flattened, one-dimensional dataset. For example, given an array like this:
[[31 12 43][42 1 16
[0 42 0]]
The Line Plot displays a flattened array, like so:
[31 12 43 42 1 16 0 42 0]
Updating the view
After advancing your program, the view does not update automatically. To refresh the display, click the Update button ( ).
).
Changing the thread of focus
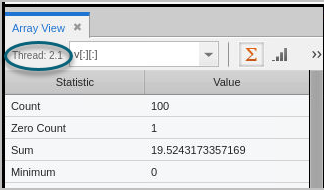
Note that, if you change the program’s thread of focus, it’s reflected on the Array View, i.e., the thread of focus has changed below, from Thread 1.1 to Thread 2.1.


