Debug a Core or Replay Recording File
To configure a core file or Replay Recording debug session, select Load Core or Replay Recording File from the Start Page. The “Core or Replay Recording Session” dialog launches.
1. Enter a name for the session in the Session Name field.
2. Select the core or Replay recording file to debug.
Use the Browse button to search the file system for the file.
3. Select the related program in the File Name field under the Program Details section.
4. Click Load Session.
Figure 22, Open a Core File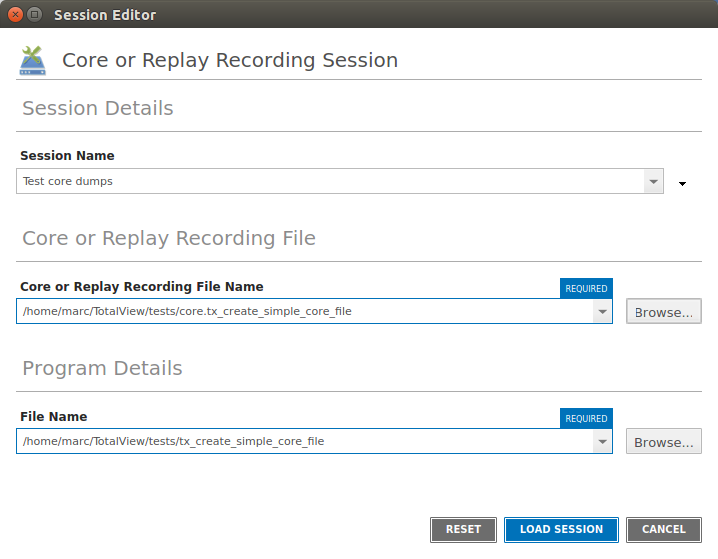
If your operating system can create multi-threaded core files (and most can), TotalView can examine the thread in which the problem occurred. It can also show you information about other threads in your program.
Similarly, TotalView can load previously saved replay recording session files to further debug applications.
When TotalView loads the core or replay recording session, it displays the core file/replay recording file, showing the state of the program. The status ribbon at the bottom of the window displays either the signal that caused the core dump, or “Recording File.” The yellow arrow and highlight in the Source Pane indicate the location of the program counter (PC) when the process encountered the error.
If you start a process while you’re examining a core file, TotalView stops using the core file and switches to this new process.
The CLI dattach command’s -c corefile-name | replayrecordingsessionfile option | |


