Starting a Python Debugging Session
To set up a Python and C/C++ debugging session with TotalView:
1. Set up a new Program Session.
Figure 80, Set up a Python Debugging Session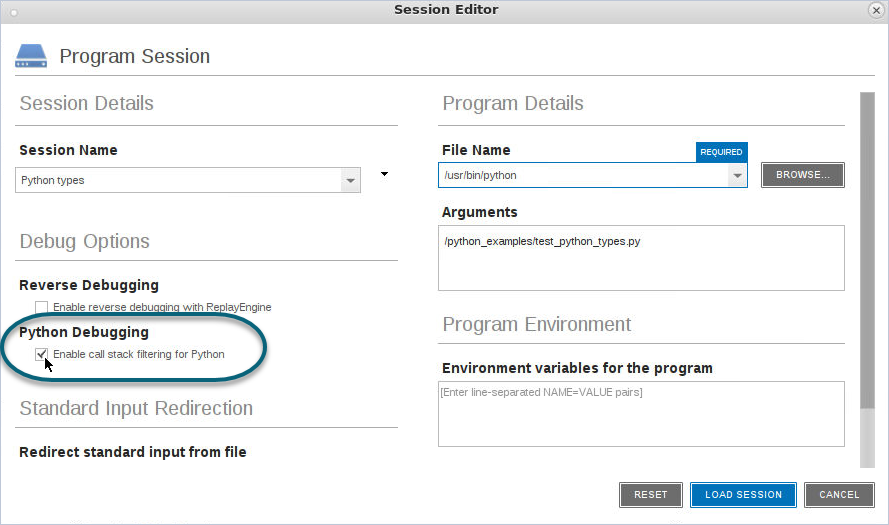
NOTE: The Python-specific option “Enable call stack filtering for Python” ensures that the call stack will display Python calls. Once selected, this option is saved with the session and will be active on next session load.
For faster startup, provide the information as command line arguments to TotalView, for example:
totalview --args /usr/bin/python test_python_types.py
2. Set breakpoints in C/C++ code and begin debugging.
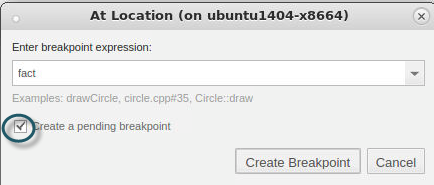
To set a breakpoint in the C/C++ Python extension code, use the At Location dialog, available via the Action Points > At Location menu.
Enter a Python extension function name or file #line location, and check “Create a pending breakpoint” to create a breakpoint in code that TotalView is not yet aware of. Click Create Breakpoint.
Figure 81, Create a Breakpoint on a Python Extension Function