The Array Visualizer
The Variable Window’s Tools > Visualize command shows a graphical representation of a multi-dimensional dataset. For instance, Figure 7 shows a sine wave in the Visualizer.
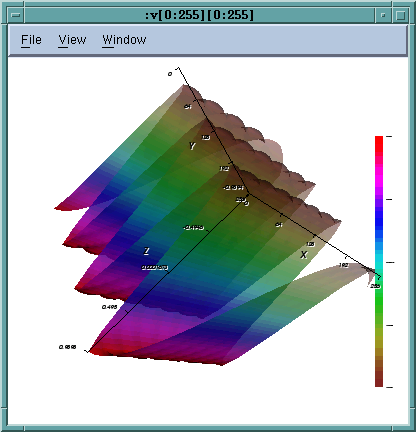 |
This helps you to quickly see outliers or other issues with your data.
The Visualizer | |
Using the Tools > Visualize and the Tools > Visualize Distribution commands | The Visualizer Window in the in-product Help |


