Window Sections
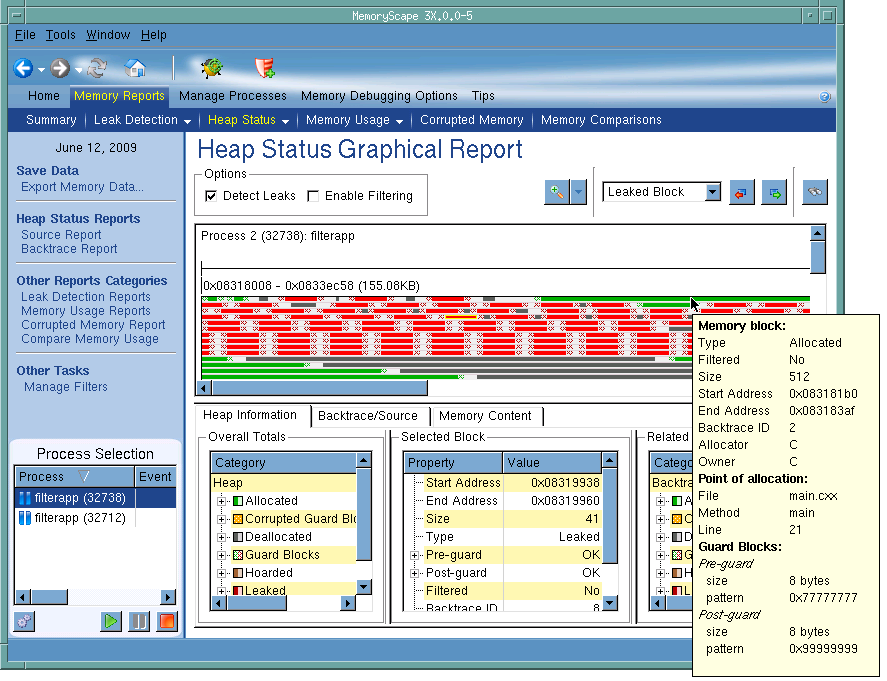
The Heap Status Graphical Report screen has three sections. The top has controls for viewing and filtering the graph. The middle contains a set of blocks that represent your memory allocations, and the bottom section provides information about blocks that you select in the middle. This bottom section can contain either heap information or a Backtrace report. (For information on Backtrace reports, see Task 8: Obtaining Detailed Heap Information.)
The grid is this screen’s most prominent feature. As most programs use more memory than can easily be displayed, you can use the zoom controls (identified by the magnifying glass in the top area) to either zoom out to see more information or zoom in to get a better view.
Figure 60: Zoom and Search Controls 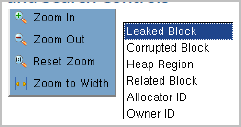 |
You can also use the search controls to move from memory block to memory block using the curved arrow buttons in the control area. The search button tells MemoryScape what kind of block to look for. There are four choices, shown in Figure 60.
By default, leaks are not marked. If, however, you select the Detect Leaks check box, MemoryScape takes a moment to analyze the heap. It then displays leaked memory blocks in red, Figure 61.
Figure 61: Heap Status Graphical Report Screen |
 |
If you select the Enable Filtering check box, MemoryScape applies filters to the display. Unlike other reports where filtered information is removed, this information is displayed in gray. For information on filtering, see Task 10: Filtering Reports.


