Additional Memory Block Information
If you expand the top area of the Block Properties window manually or if you click the Hide Backtrace/Content button, you can see additional information about the memory block, Figure 30.
Figure 30: Memory Block Properties, Hide Backtrace/Content |
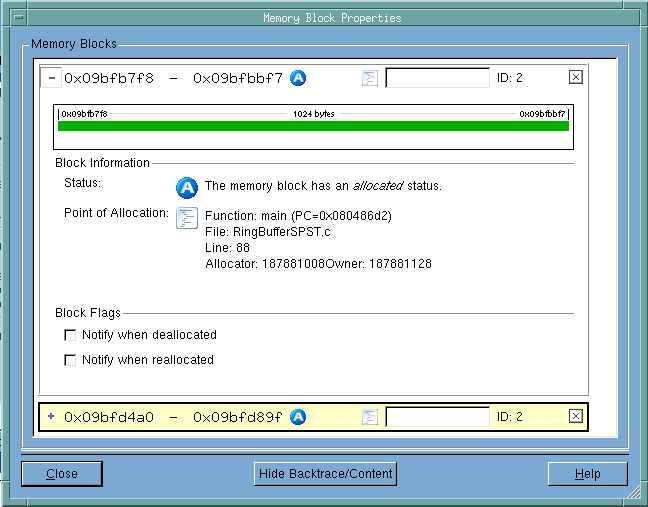 |
Block
Lists the starting and ending address of each block, its status— means allocated. As this window contains an entry for each block for which you’ve requested properties, more than one block can be displayed, as is shown here.
Comment area
As an aid to remember which block is which in this window, add a comment to the block.
Graphic display
Shows a display of the blocks similar to how it is shown in the Heap Status Graphics display and other places where memory is displayed graphically. In this example, guard blocks were used, and they are indicated by the lighter green area at the ends of the block
Block Information
Contains status information about the block.
Block Flags
Selecting a checkbox tells MemoryScape that it should stop execution and notify you when the block is deallocated or reallocated.
Close
Closes this window.
Show Backtrace/Content
Shows the Backtrace/Content part of this window that was previously concealed.
Help
Displays Help text.
Filtering
You can remove information from Backtrace and Source reports by adding a filter. For example, suppose you do not want MemoryScape to show blocks related to a standard function such as strdup(). By creating and applying a filter, MemoryScape removes this function’s information from reports. The exception is the Heap Status Graphical Report. In this report, filtered blocks are displayed using a lighter version of their ordinary color.
Filtering simplifies the display so you can more easily focus on problems. For example, filtering allows you to remove leaks originating in libraries for which you have no control.
Filtering by a function name is just one option. For more information, see Task 10: Filtering Reports.
Using Guard Blocks
When a program allocates a memory block, it is responsible for not writing data outside the block. For example, if you allocate 16 bytes, you do not want to write 32 bytes of information into it because this data would corrupt the information contained in the next block.
MemoryScape can help you detect problems related to writing data either before or after a block by surrounding blocks with a small amount of additional memory. It will also write a pattern into this memory. These additional memory blocks are called guard blocks. If your program writes data into these blocks, MemoryScape can tell that a problem occurred, as follows:
• When you are displaying a Heap Status report, you can ask for a Corrupted Guard Blocks report. The Heap Status report also shows the guard regions and corrupted blocks.
• When your program deallocates memory, MemoryScape can check the deallocated block’s guards. If they’ve been altered—that is, if your program has written data into them—MemoryScape can stop execution and alert you to the problem.
For example, suppose your program allocates 16 bytes and you write 64 bytes of data. While the first 16 bytes are correctly written, the remaining 48 aren’t. This write request will also overwrite the guard blocks for the current block and the block that follows, as well as some of the next block’s data. That is, you will have inadvertently changed some data—data that when accessed will be incorrect.
Asking for notification when the block is deallocated lets you know that a problem has occurred. Because you now know which block was corrupted, you can begin to locate the cause of the problem. In many cases, you will rerun your program, focusing on those blocks.


