Obtaining Array Statistics
The Tools > Statistics command displays a window that contains information about your array. Figure 166 shows an example.
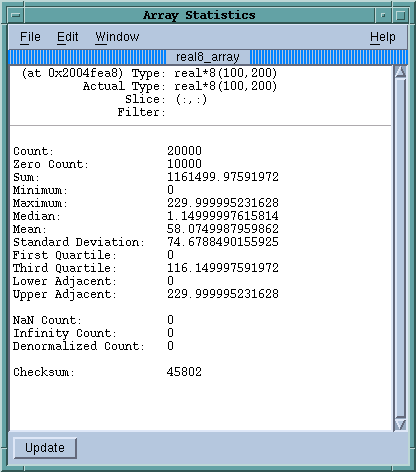 |
If you have added a filter or a slice, these statistics describe only the information currently being displayed; they do not describe the entire unfiltered array. For example, if 90% of an array’s values are less than 0 and you filter the array to show only values greater than 0, the median value is positive even though the array’s real median value is less than 0.
NOTE: Array statistics are available through the CLI, as switches to the dprint command. See the dprint description in the Reference Guide for details.
TotalView displays the following statistics:
A checksum value for the array elements.
The total number of displayed array values. If you’re displaying a floating-point array, this number doesn’t include NaN or Infinity values.
A count of the number of denormalized values found in a floating-point array. This includes both negative and positive denormalized values as defined in the IEEE floating-point standard. Unlike other floating-point statistics, these elements participate in the statistical calculations.
A count of the number of infinity values found in a floating-point array. This includes both negative and positive infinity as defined in the IEEE floating-point standard. These elements do not participate in statistical calculations.
This value provides an estimate of the lower limit of the distribution. Values below this limit are called outliers. The lower adjacent value is the first quartile value minus the value of 1.5 times the difference between the first and third quartiles.
The largest array value.
The average value of array elements.
The middle value. Half of the array’s values are less than the median, and half are greater than the median.
The smallest array value.
A count of the number of NaN (not a number) values found in a floating-point array. This includes both signaling and quiet NaNs as defined in the IEEE floating-point standard. These elements do not participate in statistical calculations.
Either the 25th or 75th percentile values. The first quartile value means that 25% of the array’s values are less than this value and 75% are greater than this value. In contrast, the third quartile value means that 75% of the array’s values are less than this value and 25% are greater.
The standard deviation for the array’s values.
The sum of all the displayed array’s values.
This value provides an estimate of the upper limit of the distribution. Values above this limit are called outliers. The upper adjacent value is the third quartile value plus the value of 1.5 times the difference between the first and third quartiles.
The number of elements whose value is 0.


