MemoryScape Information
Most of the information you will use is contained within the Memory Reports tab. Here is an overview of the kinds of reports that you can receive.
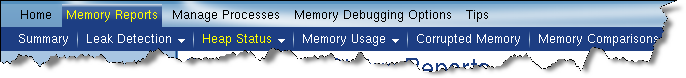
Figure 36: Report Tabs |
 |
• Leak Detection. The Backtrace and Source reports in this section are identical in format to those shown in the Heap Status reports. They differ in that they only show leaked memory. You can group these leaks in different ways. One of the most useful is to isolate the largest leaks and then search for solutions to these problems first. For information on these reports, see Task 9: Seeing Leaks.
These reports, as well as the Heap Status reports, can contain considerable information. You can exclude information from Source and Backtrace reports by filtering it. See Task 10: Filtering Reports for more information.
• Heap Status. The reports in this section give you information on all of your program’s allocations and deallocations. In particular, MemoryScape also groups allocations by the place where the allocation occurred. This information includes the backtrace—which is your program’s call stack when the allocation occurred—and the source line that allocated the memory.
The Backtrace and Source reports present this information in tabular form. The Heap Status Graphical Report is an easy way to browse through the program’s allocated blocks. Also, placing your mouse over a block gives you information about that block. (See Figure 61.)
For information on these Heap Status reports, see Task 7: Graphically Viewing the Heap and Task 8: Obtaining Detailed Heap Information.
• Corrupted Memory. MemoryScape can analyze your program’s memory blocks to see if the program wrote past a block’s boundaries. If you had set the enable guard blocks option, selecting this report shows corrupted blocks.
For information, see Task 11: Viewing Corrupted Memory.
• Memory Comparisons. MemoryScape lets you save memory state information and read it back in. After it is read back in, you can compare it against the current memory state. Or, you can read in an another save memory state and compare the states against one another.
After MemoryScape reads in saved information, you can obtain reports on the information in exactly the same way as you obtain reports for an executing program.
For information, see Task 13: Comparing Memory.
• Memory Usage. MemoryScape can display charts of how much memory is being used and how this memory is allocated in sections of your program. It can do this for one or more of your program’s processes.
For information, see Task 5: Seeing Memory Usage.


