Controlling the Display of Processes and Threads
The Root Window's layout enables you to modify the grouping parameters while viewing the results.
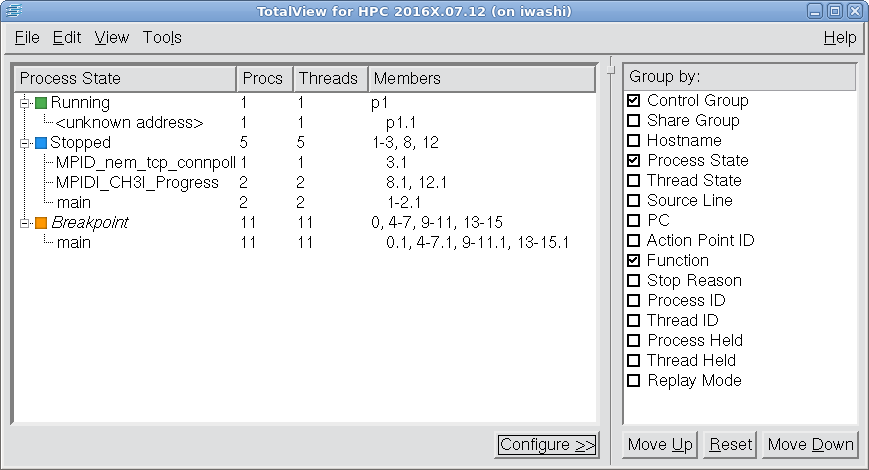
Figure 63 illustrates a 17-process MPI job comprised of a single MPI starter process, e.g., mpiexec (
p1), and 16 MPI processes (0-15). At the highest level, processes are grouped by
Process State, then by
Function. The individual groupings are then sorted in ascending order (
Members) by the process ID.
 Configure
: Show or hide the configuration panel on the right using the
Configure button or the
View > Show Configure Panel menu item.
Move Up and Move Down: By default, the properties are displayed in a hierarchical manner, such that the property at the top of the Configuration Panel forms the highest level grouping, the next property forms the second level of grouping subordinate to the first, and so on. Use
Move Up and
Move Down to control where to display a property in the hierarchy.
Reset: The selected groupings and their relative order are automatically saved across TotalView sessions. To revert to the default order, press
Reset.
Nested Attributes: Instead of the default hierarchical display, the properties can be "flattened" into a single line in which each property is separated by a colon, using the
View > Nested Attribute menu item. This menu item toggles between the hierarchical and flat display modes.
Show MPI Rank: For MPI jobs, TotalView shows by default the rank in MPI_COMM_WORLD of MPI processes in the compressed
ptlist in the Members column. Non-MPI processes are shown using the "
pdpid" where
dpid is the debugger process ID of the process. Use the
View > Show MPI Rank menu item to toggle between displaying MPI processes using the MPI rank or "
pdpid" notation.
Expand/Collapse All: Minimize or fully expand the entire tree with
View > Expand All and
View > Collapse All.
Copy/Select All: To copy data to an external program, use the clipboard: Select one or more rows using your computer’s keyboard shortcuts, or select
Edit > Select All, and copy to the clipboard using
Edit > Copy.
Default View
By default, the Root Window displays Control Group, Process State, Function and Thread ID in a hierarchical or "nested" manner.
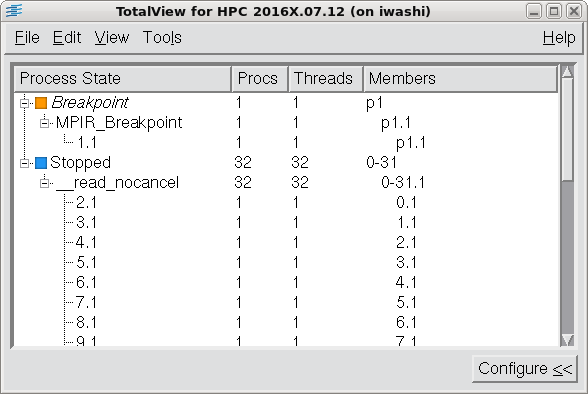
Figure 64 shows a 32-process, 32-thread MPI job, each process containing one thread, which is a single-threaded MPI starter process (e.g., mpiexec).
Since there is only one control group in the debug session, the control group has been omitted, and the Process state becomes the top-level property, in this case displaying two process states.
Breakpoint: The first grouping lists the MPI starter process in
Breakpoint process state, stopped in function
MPIR_Breakpoint, and one thread with thread ID
1.1. The
Procs column shows the number of processes, and the
Threads column shows the number of threads displayed in the Members column. The
Members column shows the
dpid the process and
dpid.dtid of the threads, displayed as a compressed process/thread list
ptlist.
Stopped: This grouping displays all processes in a
Stopped process state, of which there are 32, the MPI job size. The membership shows 0-31, which means MPI ranks 0 to 31, inclusive.
Changing the Display
To change the view, select the
Configure << button and select or de-select properties.
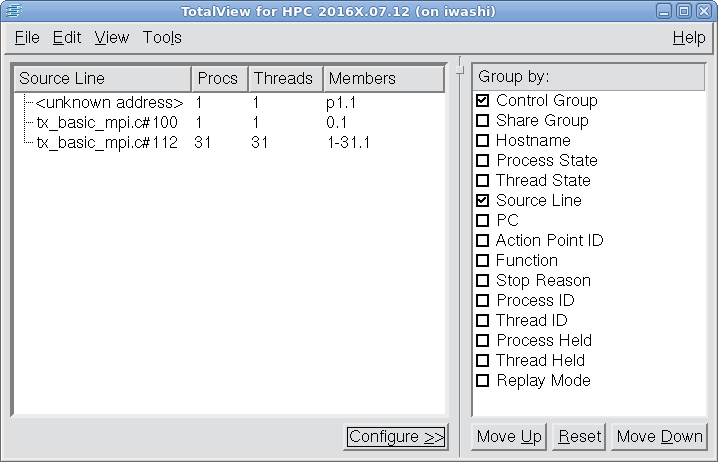
Figure 65 shows a configuration where just the Source Line property is selected.
.
In this example, we've de-selected Process State, Function, and Thread ID and selected Source Line in order to group by Source Line instead.
Because Source Line is a thread property, the Members column now displays only threads. Here are the three lines:
Line 1 is the
mpirun process used to launch the
tx_basic_mpi mpi program.
Line 2 displays all the threads at Line 100 in the source file
tx_basic_mpi.c. The membership is 0.1, which means thread (dtid) 1 in MPI rank 0.
Line 3 displays all the threads that are at line 112 inside that same file, representing the remaining 30 threads.
Note that even though the Control Group is selected, it has no grouping effect most of the time and is relevant only for debugging multiple jobs at once (which is uncommon), in which case the window would display a separate top-level control-group grouping for each job.
Grouping by Status and Source Line
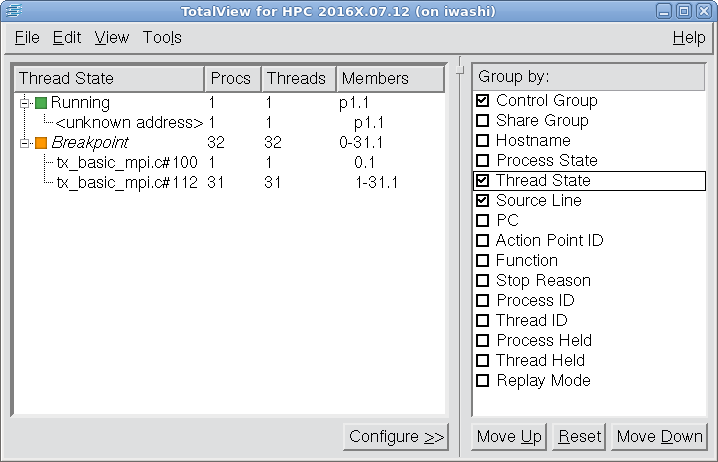
If you select Thread State, leaving Source Line also selected, you can group by both properties, as in
Figure 66.
Again, there are two groupings in the list: the first is the mpirun process. Note that the second grouping is now multi-line:
The first line of the second grouping displays a single thread, showing both that its status is at
Breakpoint and that it is at line 100 in
tx_basic_mpi.c.The second line displays 31 threads, all at a different
Breakpoint at line 112 in
tx_basic_mpi.c.