Print Statements vs. Action Points
Print statements are common in debugging, in which you insert printf() or PRINT statements in your code and then inspect the output. However, using print statements requires that you recompile your program; further, the output may be difficult to navigate as it is likely to be out of order when running multi-process, multi-threaded programs.
You can still use printf() statements if you wish — but more effectively and without recompiling your program. Simply add a breakpoint that prints information, using the Action Point Properties, dialog, Figure 90, which adds any code you want to a breakpoint.
NOTE: In this discussion, the term "breakpoint" is often used interchangeably with the broader TotalView-specific term "action point."
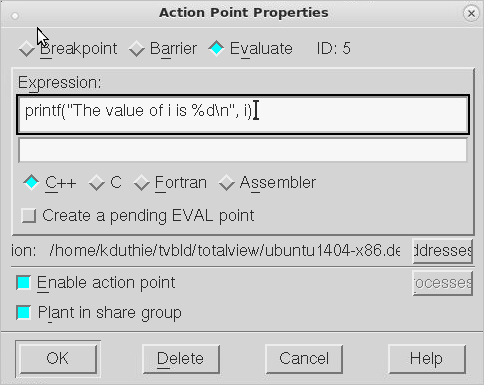 |
A breakpoint with associated code is an eval point. When your program reaches an eval point, TotalView executes the code. For instance, in the above case, TotalView prints the value of i.
Eval points do exactly what you tell them to do. Note that, in Figure 90, TotalView allows your program to continue to execute because you didn’t tell it to stop. In other words, you don’t have to stop program execution just to observe print statement output.
Figure 91 shows two eval points that do stop execution.
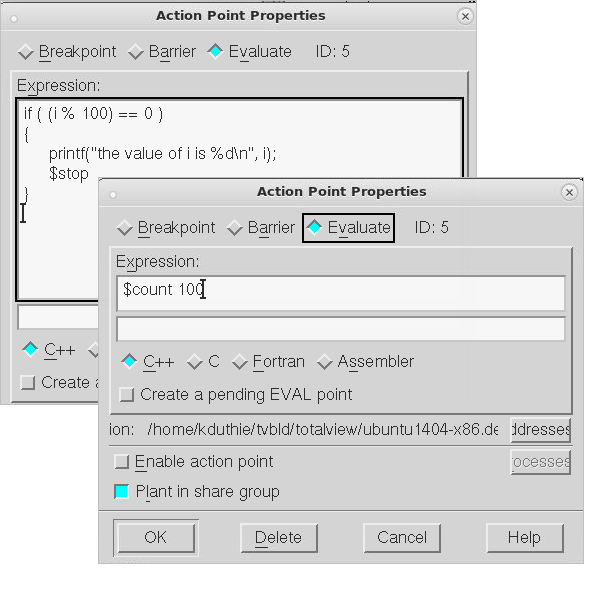 |
The eval point in the background uses programming language statements and a built-in debugger function to stop a loop every 100 iterations. It also prints the value of i. In contrast, the eval point in the foreground just stops the program every 100 times a statement is executed.
These are just a few ways that action points can define print statements. More examples can be seen throughout this chapter.


