Debugging with TotalView
You may find that you want to exert greater control over your process execution than MemoryScape provides, or you may want to examine variables as you go. To do so, MemoryScape can bring up the TotalView Process Window.
There are two ways to debug with TotalView:
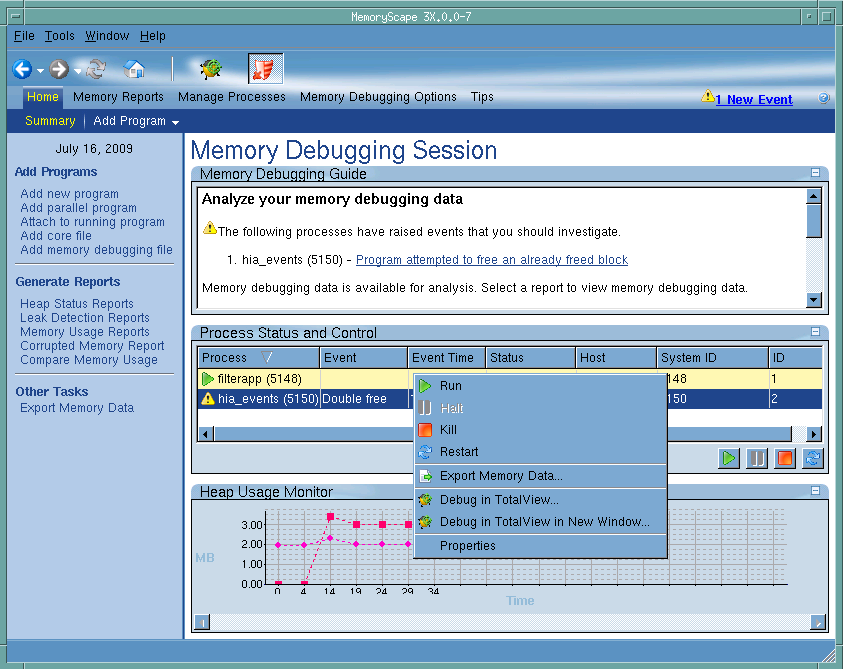
• Select a process and use the pop-up menu options Debug in TotalView or Debug in TotalView in New Window, Figure 31.
• Use the icon in the MemoryScape toolbar. 
Be aware that opening the TotalView Process Window from within MemoryScape does not initialize TotalView in the same way as starting TotalView directly. The definitions in your .tvdrc file and your saved breakpoints are not loaded. However, you can load a breakpoint file using the Action Point menu item in the Process Window. If you need the definitions in your .tvdrc file, start TotalView first and open MemoryScape from within TotalView.
Figure 31: Memory Debugging Session Menu |
 |


