Starting MemoryScape
On most architectures, there is not much you need to do to prepare your program for memory debugging. In most cases, just compile your program using the -g command-line option. In some cases, you may need to link your program with the MemoryScape agent. (See Chapter 4, Creating Programs for Memory Debugging for more information.)
Here is how you start MemoryScape:
1. Start MemoryScape from a shell window. On a Macintosh, depending upon how it was installed, you can start it using the MemoryScape program icon.
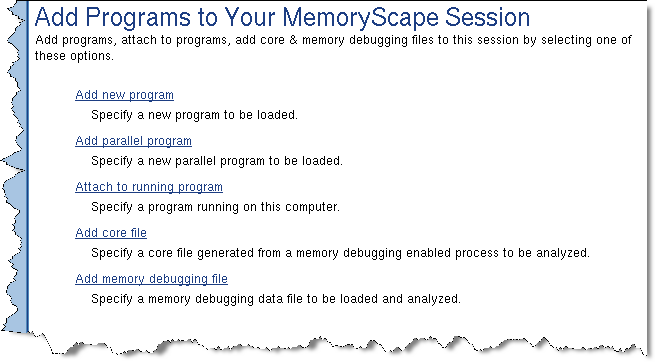
Figure 14: Add Programs to Your MemoryScape Session |
 |
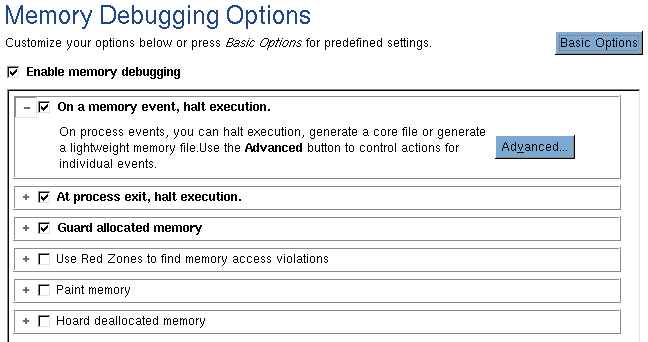
3. If you need to, select your memory debugging options. In most cases, the defaults are fine. In some cases, you may want to select Low, Medium, High, or Extreme. If you need finer control, select the Advanced Options button, Figure 15. For more information, see Task 3: Setting MemoryScape Options.
Figure 15: Memory Debugging Options |
 |
4. After setting options, MemoryScape displays a screen that lets you start program execution, Figure 16.
Figure 16: Program Created Screen 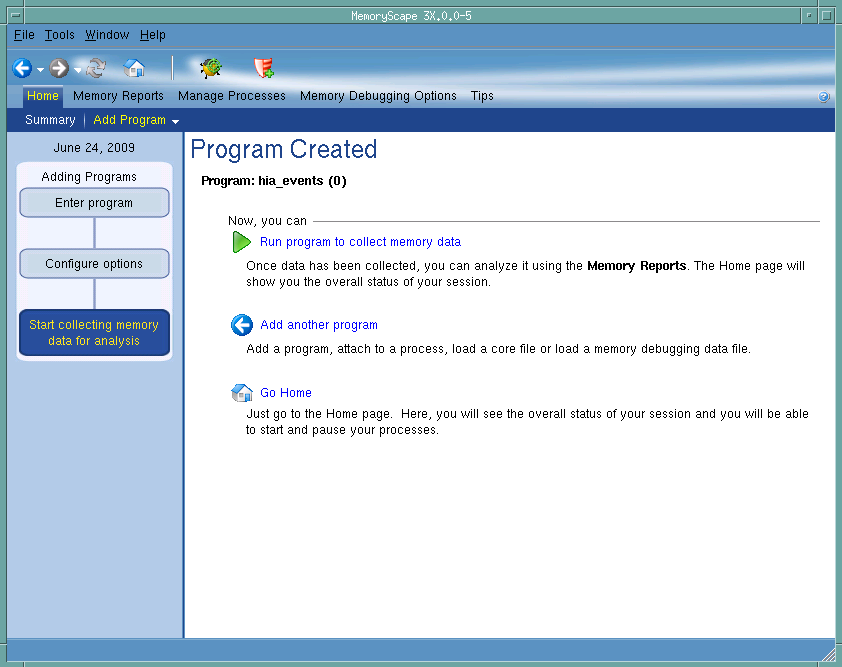 |
Whenever your program is stopped—which happens when you halt the program, when a memory problem occurs, or just before the program exits—MemoryScape can create a report that describes leaks or one that shows or describes currently allocated memory blocks.


